Thursday, July 7, 2016

The Deepening Fraud of Comex Silver

Published here: http://redirect.viglink.com?u=http%3A%2F%2Fwww.zerohedge.com%2Fnews%2F2016-07-07%2Fdeepening-fraud-comex-silver&key=ddaed8f51db7bb1330a6f6de768a69b8

The Deepening Fraud of Comex Silver

Posted with permission and written by Craig Hemke, TF Metals Report (CLICK HERE FOR ORIGINAL)


Recently, we've written quite often of the surge in Comex gold open interest and the attempts by The Banks to manage the paper derivative price by increasing the paper derivative supply. In this post, we turn to Comex silver, where The Banks are pulling the same tricks but with a very interesting twist.

Again, if you haven't been following the increases in Comex gold open interest and how The Banks use fresh derivative supply to dampen the paper price, please check our most recent update here:
http://www.tfmetalsreport.com/blog/7700/onward-toward-bullion-bank-collapse

But let's take this analysis in a different direction today. As we've meticulously noted, the price of gold is now up over $300 in 2016, from $1060 to today's $1370, for a total gain of 29.2%. Over this same time period, the total amount of contracts floating on the Comex has also increased from 415,220 on 12/31/15 to yesterday's 652,971. That's an increase of 201,751 contracts or 48.6%. Looked at another way...Since every Comex contract represents an obligation for 100 ounces of gold, the total supply of "paper gold" has increased by 20,175,100 troy ounces or about 627 metric tones.

So, over the same time period, have we seen any change to the total amount of gold allegedly held within the vaults of the eight Comes repositories? As a matter of fact we have! As you can see below, the total amount of Comex vaulted gold on 12/31/15 was
6,414,643 troy ounces, with 276,000 in the registered category and the rest listed as eligible:


And now look at the most recent report from yesterday:


Well, how about that? Over the same time period, the amount of gold allegedly vaulted on the Comex has increased by over 3,000,000 ounces and, internally, the total registered stock has increased by more than 1,100,000 ounces. Now before anyone claims that this demonstrates the legitimacy of the Comex and The Paper Derivative Pricing Scheme, be sure to note that total paper claims increased by over 20,000,000 ounces over the same time period. So, in the most crude of calculations, we can say that The Banks took the newly-vaulted gold, levered it over six times and then flooded it into the "market" as a way to control the ascent of price.

But let's not stop there because that's not the focus of this post. Before the Cartel/System Apologists and Shills take the information above and claim that all is well and that the Comex is working as it should, perhaps they should look at the same numbers in
Comex silver.

Back on December 31, 2015, Comex silver closed at $13.80. As I type, I have a last of $20.10. This is a gain of $6.30 or about 46%. Over the same time period, The Banks that "make markets" on the silver Comex have increased total open interest from 168,153 contracts to yesterday's 211,347. That's an increase of 43,194 contracts or 26%. And again, stated another way, at 5000 ounces per contract, this represents about 216,000,000 ounces of additional paper silver.

So, have we also seen an increase in the total amount of silver vaulted in the eight Comex silver repositories? Well, let's check. Below is the report from December 31, 2015. Note that the vaults hold a total of 160,671,058 ounces of silver, of which a little over 25% or 40,000,000 ounces is in the registered category:


And now here's your report from yesterday:


So, the paper price of silver has risen by 46% WHILE the amount of available paper silver derivatives has increased by 26%. At the same time, the total amount of silver held within the Comex vaults has decreased by 5.6%. Perhaps even more interesting, while price has risen 46%, the total amount of registered Comex silver has decreased by 15,638,897 ounces or 39%.

Let's sum it up this way:

COMEX GOLD: Price up 29%. Total open interest up 48.6%. Total vaulted gold up over 3,000,000 ounces or 47%.

COMEX SILVER: Price up 46%. Total open interest up 26%. Total vaulted silver DOWN nearly 9,000,000 ounces or 5.6%.

And let's consider one more thing...

With total open interest of 652,971 contracts, the Comex currently has paper obligations for 65,297,100 troy ounces or 2,031 metric tonnes of gold. Total annual mine supply is around 3,000 metric tonnes so total Comex paper derivative supply equals about 66% of total mine supply.

However, with total open interest of 211,247 contracts, the Comex currently has paper obligations for 1,056,235,000 ounces of silver. Total annual mine supply is around 880,000,000 million ounces so total Comex paper derivative supply equals about 120% of
total mine supply.

Putting it all together...

While it's clear that The Banks on The Comex are desperately feeding new paper contracts to The Specs in an effort to contain/restrain the gold price, at least there has been a coincident rise in the physical collateral backing the paper contracts. In silver, where the situation is equally tenuous, The Banks are issuing new paper contracts without conjuring up any additional physical collateral. The Banks are simply adding additional leverage to an already-teetering system and, in doing so, have extended their potential delivery liability to 120% of total global mine supply. (Actually, if you take out China's 150,000,000 ounces of annual production that's NOT for sale, total global silver production falls to 730,000,000 ounces and the liability rises to 145%!)

In 2011, the Comex price of silver shot higher due, in large part, to physical demand. This run culminated in a $10 move during the month of April that was almost entirely driven by near-panic short covering by The Comex Banks. The CFTC-generated data at the time left zero doubt regarding this conclusion. Only The Sunday Night Massacre of May 1, 2011 and the CME's five margin hikes in the nine days that followed saved The Banks from massive further losses and possible collapse.

Could silver be on the verge of another, similar event? Only time will tell and global physical demand will be the key. However, silver investors would be wise to consider the possibilities and act accordingly, knowing full well the extent of the fraud and scam of the current Comex Paper Derivative Pricing Scheme.


Please email with any questions about this article or precious metals HERE


The Deepening Fraud of Comex Silver

Posted with permission and written by Craig Hemke, TF Metals Report (CLICK HERE FOR ORIGINAL)

Property Fund Turmoil in the UK has Eerie Echoes of Bear Stearns

Published here: http://redirect.viglink.com?u=http%3A%2F%2Fwww.zerohedge.com%2Fnews%2F2016-07-07%2Fproperty-fund-turmoil-uk-has-eerie-echoes-bear-stearns&key=ddaed8f51db7bb1330a6f6de768a69b8

The fallout from Brexit continues and financial uncertainty can be seen in the markets as the British Pound continues to come under pressure and a growing number of property funds in the UK freezing redemptions. The Telegraph's Ben Marlow draws some chilling comparisons with the Bear Stearns crisis of 2007.

Almost nine years since that fateful day, and the ghost of Bear Stearns is stalking the Square Mile again after the lockdown of three of the UK’s biggest property funds.

Bear Stearns

After the initial post-Brexit rout, which resulted in sterling and equities getting pummelled, markets looked to have finally calmed down with the FTSE 100 moving past its pre-Brexit level.

However, investors have been spooked once again after insurance giants Standard Life, Aviva and M&G, froze redemptions in their retail property funds.

 
The full report can be read here 
 

7RealRisksBanner


Gold and Silver News

Read More Here

Gold Prices (LBMA AM)
07 July: USD 1,367.10, EUR 1,233.40 & GBP 1,052.80 per ounce
06 July: USD 1,347.00, EUR 1,239.71 & GBP 1,059.01 per ounce
05 July: USD 1,344.75, EUR 1,207.05 & GBP 1,023.89 per ounce
04 July: USD 1,348.75, EUR 1,213.07 & GBP 1,016.42 per ounce
01 July: USD 1,331.75, EUR 1,199.51 & GBP 1,001.34 per ounce
30 June: USD 1,317.00, EUR 1,183.59 & GBP 976.82 per ounce
29 June: USD 1,318.00, EUR 1,191.64 & GBP 984.36 per ounce

Silver Prices (LBMA)
07 July: USD 19.95, EUR 18.00 & GBP 15.31 per ounce
06 July: USD 20.43, EUR 18.46 & GBP 15.75 per ounce
05 July: USD 19.73, EUR 17.69 & GBP 14.99 per ounce
04 July: USD 20.36, EUR 18.31 & GBP 15.36 per ounce
01 July: USD 19.24, EUR 17.29 & GBP 14.48 per ounce
30 June: USD 18.36, EUR 16.48 & GBP 13.61 per ounce
29 June: USD 18.21, EUR 16.42 & GBP 13.55 per ounce

Recent Market Updates

- Gold Has Entered a New Phase According to UBS
- "In Gold We Trust" Annual Report - New Bull Market "Emerging"
- 3 Charts Show "How Precious Brexit Is" for Gold and Silver Bullion
- Gold, Silver Best Performing Assets In H1, 2016 – Up 26% & 38%
- BREXIT Creates EU Contagion Risk – Ramifications for Investors, Savers and Companies In Ireland
- BREXIT Day – Markets Becalmed – Gold Panic Prelude – Trading Hours
- Gold Lower Despite “Panic” Due To “Supply Issues” In Inter Bank Gold Market
- Gold Slips Despite UK Gold Demand Surging – Investors “Seek Stability”
- Gold Prices Surge to Highest in Nearly Two Years On FED and Brexit Haven Demand
- Gold Bullion Has Little Downside, Brexit Or Not, Says HSBC
- Central Bank of Ireland Warns Risks are Debt, Brexit, Geopolitical Tensions and Migration
- Gold In Euros Surges 6.5% In June and 17% YTD On BREXIT Concerns
- Soros Buying Gold On BREXIT, EU “Collapse” Risk
- UK Gold Demand Rises On BREXIT “Nerves”
- Pensions Timebomb in “Slow Motion Detonation” In UK, EU, U.S.

Wednesday, July 6, 2016

Americans & Canadians Face Silver Shortages As The Investment Deficit Surges

Published here: http://redirect.viglink.com?u=http%3A%2F%2Fwww.zerohedge.com%2Fnews%2F2016-07-06%2Famericans-canadians-face-silver-shortages-investment-deficit-surges&key=ddaed8f51db7bb1330a6f6de768a69b8

SRSrocco

By the SRSrocco Report,

Americans and Canadians will likely face silver shortages in the future as investment demand continues to surge higher.  This will come at time as the silver price skyrockets, thus making it even harder for investors to acquire physical metal.

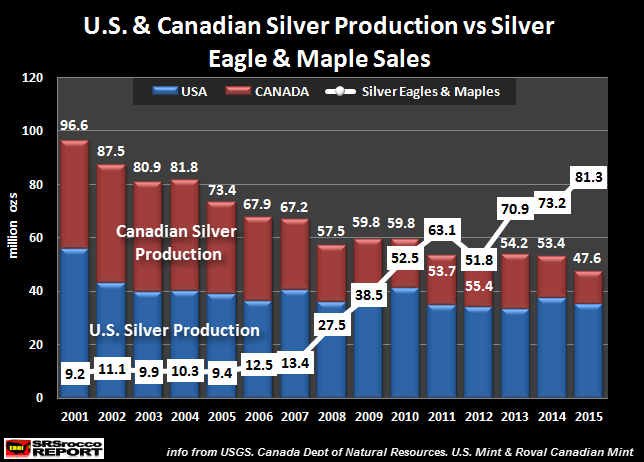
The U.S. and Royal Canadian Mints produce most of the Official Silver coins in the world.  In 2015, the combined total of Silver Eagles and Maples sales equaled 81.3 million ounces (Moz).  This is a stunning amount as their total sales in 2001 were only 9.2 Moz:

U.S. & Canadian Silver Production vs Official Coin sales

This chart was first published in my THE SILVER CHART REPORT.  It was one of 48 charts in the report on five sections of the Global Silver Market & Industry.

The Silver Chart ReportAs the price of silver skyrockets during the next global financial collapse, the Silver Market will become one of the world's most explosive markets in the future.
The Silver Chart Report is a must-read for the new and experienced precious metals investor. Most analysts focus on a certain area or sector of the silver market.

However, the information in this report illuminates a holistic view of many sectors of the silver industry, capturing the relationships that connect many parts of the market.

CLICK HERE to lean more about THE SILVER CHART REPORT.

As the chart above shows, U.S. and Canada had to import nearly 34 Moz of silver in 2015 just to supply the surging Silver Eagle & Maple demand of 81.3 Moz, as their combined silver production of 47.6 Moz fell significantly short.  This was a huge change since 2001, as the U.S. and Canada had 87.4 Moz of their domestic silver mine supply remaining after 9.2 Moz went to their U.S. Eagle and Maple sales.

Even though the U.S. and Canada had to import 34 Moz in 2015 just to supply their Official Silver coin program, this is only part of the total net physical silver investment deficit.  If we include total U.S. and Canadian Silver Bar & Coin demand, the silver investment deficit is much larger.

Surging U.S. & Canadian Silver Bar & Coin Demand Cause The Investment Deficit To Balloon Higher

If we add the revised Silver Bar demand published in the 2016 World Silver Survey, now including "Private silver bars & rounds", this would be the result:

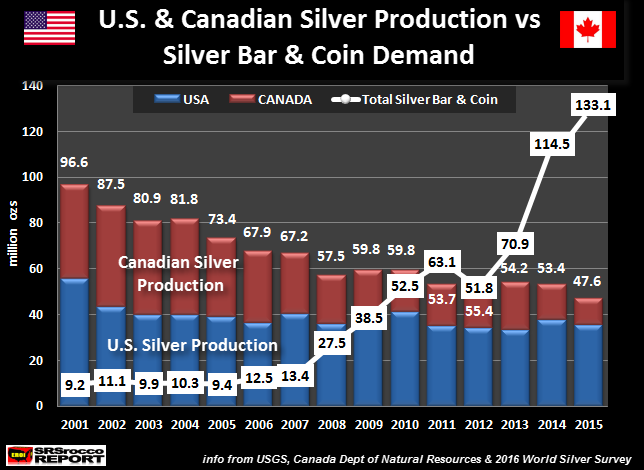
U.S. & Canada Silver Production vs Silver Bar & Coin

I only revised the data for 2014 and 2015 which includes Silver Bar demand.  I could not revise the data for 2001-2013 as there isn't enough detailed information in the World Silver Surveys to provide accurate figures.  However, we can now see just how much more physical silver investment demand there is in the U.S. and Canada when we include Silver Bar demand.

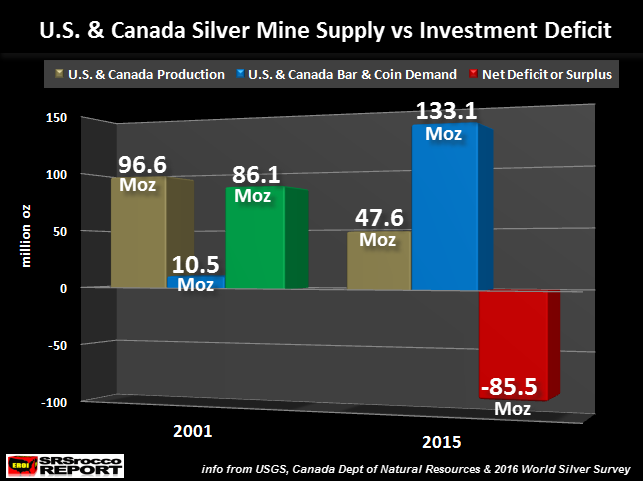
If I take these figures, now including private silver bars and rounds, we can see the huge impact on domestic mine supply since 2001:

U.S. Silver Mine Supply vs Investment Deficit

In 2001, the U.S. and Canada enjoyed a 86.1 Moz domestic silver mine supply surplus when total Silver Bar & Coin demand was deducted (Silver Eagle & Maple sales were 9.2 Moz and I estimated Silver Bar was 1.3 Moz for a total of 10.5 Moz).  However, the situation has totally reversed as U.S. and Canadian Silver Bar & Coin demand hit a record 133.1 Moz in 2015.

NOTE:  The World Silver Surveys do not provide actual Official Silver coin demand figures for the U.S. or Canada (or for any other country).  What they publish are total sales of each country's Official Silver coin sales.  Many Silver Eagles & Maples are purchased by foreigners.  However, I believe Americans and Canadians purchase higher quantities of foreign Official Silver coins (Australian Kangaroos and Austrian Philharmonics) to offset Silver Eagles and Maples shipped abroad.

That 133.1 Moz Silver Bar & Coin demand figure for the U.S. and Canada includes 81.3 Moz of Silver Eagles and Maples as well as 51.8 Moz of reported U.S. Silver Bar demand (which now includes private bars and rounds).  GFMS did not include any data for Canadian Silver Bar demand.  Which means, the 133.1 Moz figure for the U.S. and Canada may be conservative.

That being said, the U.S. and Canada suffered a 85.5 Moz net physical silver investment deficit.  Which means, these two countries had to import 85.5 Moz of silver just to supply Silver Bar & Coin demand.  This is a big deal if we compare the change since 2001.

Total U.S. & Canada Silver Fabrication Supply Shortfall Triples Since 2001

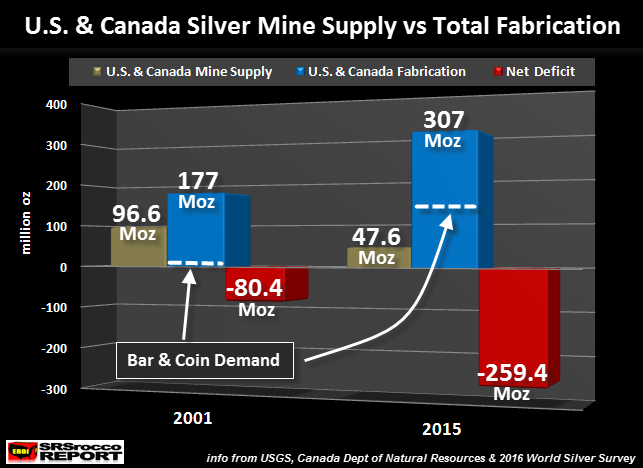
According to the data from the 2010 World Silver Survey, total U.S. and Canadian silver fabrication demand in 2001 was 177 Moz.  Total silver fabrication demand includes industrial, jewelry, silverware and silver bar & coin.  Thus, the U.S. and Canada only had to import 80 Moz of silver to supply all their silver needs in 2001.

U.S. & Canada Mine Supply vs Total Fabrication

However, in 2015.... the situation changed drastically.  The 2016 World Silver Survey reports that total silver fabrication demand for these two countries was a staggering 307 Moz--Silver Bar & Coin demand accounted for 133 Moz (43% of the total).  Now that U.S. and Canadian domestic silver mine supply has fallen to only 47.6 Moz (in 2015), these two countries had to import nearly 260 Moz to supply all their silver needs.  This is more than three times what they had to import in 2001.

The white dotted lines in the total fabrication blue bars in the chart represent Silver Bar & Coin Demand.  In 2001, total Silver Bar & Coin demand was estimated to be 10.5 Moz, accounting for only 6% of total silver fabrication demand.  However, total Silver Bar & Coin demand in 2015 shot up to 133 Moz, which represents 43% of the total 307 Moz in total fabrication demand of these two countries.

Here is the CLINCHER.  Total U.S. and Canadian silver industrial, jewelry and silverware demand (minus Silver Bar & Coin), only increased from 166.5 Moz in 2001 to 174 Moz in 2015.  The big increase came from Silver Bar & Coin demand that jumped from 10.5 Moz in 2001 to 133 Moz in 2015.

The United States and Canada will be in serious trouble when the world wakes up to the "SILVER STORY."  When institutions and hedge funds start to move into silver in a big way, there just won't be enough silver to go around.  The biggest squeeze will occur in the U.S. and Canadian market, where silver investment demand is now the highest in the world.

Unfortunately, the U.S. and Canada will not be able to import enough silver to supply all of its silver needs.... only at much higher prices.  Even then, I believe we are going to experience severe silver shortages.

Some analysts say there is no such thing as a shortage.  They claim that a higher price will satisfy any shortages.  While that makes sense in FINANCE 101, it won't work in the real market as investment demand skyrockets.

The Silver Threshold Line Will Likely Be Defended By The Bullion Banks

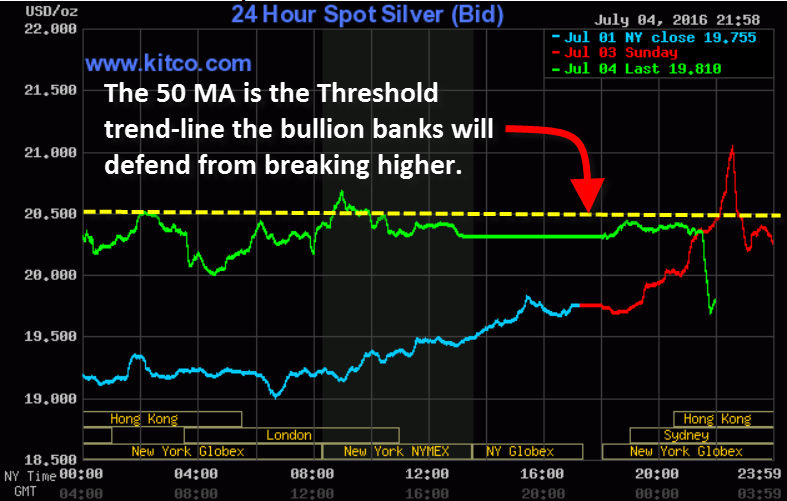
For those investors who thought we would continue to see much higher silver prices in early Asian trading today or in the Western markets tomorrow, don't forget that the bullion banks will likely defend the 50 MA of $20.50.  Here is Kitco's silver chart showing early Asian trading:

Silver Chart 50 MA

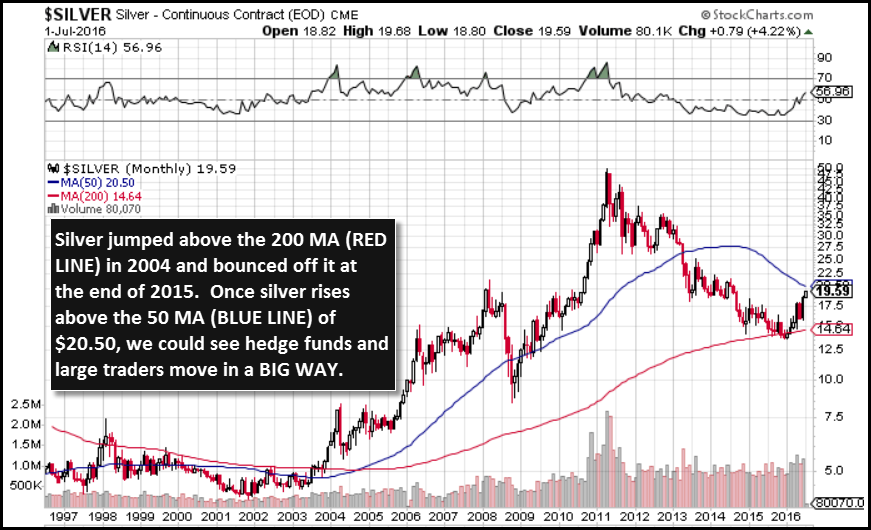
The yellow dotted line represents the $20.50 Threshold trend-line that I wrote about in my previous article, WATCH OUT If Silver Breaks Through This Threshold Line:

Silver 20 Year chart

While I don't pay much attention to short-term technical analysis, a lot of traders most certainly do.  Once silver closes well above that 50 MA (Blue Line), I believe we will see a lot more hedge funds and big investors pile into the silver market.  However, this is not something the Bullion banks would like to see as they are holding onto a lot of UNDERWATER short contracts.

So, don't despair, as this is just part of the game.  At some point, an onslaught of traders moving into silver will totally overwhelm the bullion banks and we will finally see that Commercial Bank Short Squeeze from hell.  Investors need to realize that the Chinese who are now piling into Bitcoin, will likely make their way into silver.

....... it's just a matter of time.

Lastly, if you haven't checked out our new PRECIOUS METALS INVESTING section or our new LOWEST COST PRECIOUS METALS STORAGE page, I highly recommend you do.

Check back for new articles and updates at the SRSrocco Report.

"Gold Has Entered a New Phase" Says UBS

Published here: http://redirect.viglink.com?u=http%3A%2F%2Fwww.zerohedge.com%2Fnews%2F2016-07-06%2Fgold-has-entered-new-phase-says-ubs&key=ddaed8f51db7bb1330a6f6de768a69b8

With gold prices having risen by 24% in dollar terms already this year, UBS analyst Joni Teves declared in a note to clients yesterday that; “gold has entered a new phase”.

gold ytd ubs
Here’s the key reasoning behind that forecast, from UBS’ Global Precious Metals Comment note according to Business Insider today:

Key drivers include: 1) low/negative real rates, 2) the view that the dollar has peaked against DM currencies, and 3) lingering macro risks. We expect the next leg to be driven by an extension of the trend of strategic portfolio allocation into gold from a diverse set of investors. This trend should now deepen, attracting more participants and encouraging those who have been hesitating to get more involved. Relatively orderly retracements, which have typically been shallow and brief indicates strong buying interest. This suggests that gold’s floor is likely higher now given an even stronger fundamental argument for holding gold.

Teves continues:

The UK’s vote to leave the EU further underpins gold’s macro narrative, reinforcing the themes of further dovish shifts in monetary policies, consequently lower yields, and heightened uncertainty. We continue to expect US real rates to fall from here and ultimately for equilibrium real rates to settle lower and have limited upside. These factors justify strategic gold allocations across different types of investors and we expect this trend to continue.

The full report can be read here 

7RealRisksBanner


Gold and Silver News

Read More Here

Gold Prices (LBMA AM)
06 July: USD 1,347.00, EUR 1,239.71 & GBP 1,059.01 per ounce
05 July: USD 1,344.75, EUR 1,207.05 & GBP 1,023.89 per ounce
04 July: USD 1,348.75, EUR 1,213.07 & GBP 1,016.42 per ounce
01 July: USD 1,331.75, EUR 1,199.51 & GBP 1,001.34 per ounce
30 June: USD 1,317.00, EUR 1,183.59 & GBP 976.82 per ounce
29 June: USD 1,318.00, EUR 1,191.64 & GBP 984.36 per ounce
28 June: USD 1,312.00, EUR 1,185.79 & GBP 985.84 per ounce

Silver Prices (LBMA)
06 July: USD 20.43, EUR 18.46 & GBP 15.75 per ounce
05 July: USD 19.73, EUR 17.69 & GBP 14.99 per ounce
04 July: USD 20.36, EUR 18.31 & GBP 15.36 per ounce
01 July: USD 19.24, EUR 17.29 & GBP 14.48 per ounce
30 June: USD 18.36, EUR 16.48 & GBP 13.61 per ounce
29 June: USD 18.21, EUR 16.42 & GBP 13.55 per ounce
28 June: USD 17.57, EUR 15.84 & GBP 13.17 per ounce

Recent Market Updates

– “In Gold We Trust” Annual Report – New Bull Market “Emerging”
– 3 Charts Show “How Precious Brexit Is” for Gold and Silver Bullion
– Gold, Silver Best Performing Assets In H1, 2016 – Up 26% & 38%
– BREXIT Creates EU Contagion Risk – Ramifications for Investors, Savers and Companies In Ireland
– BREXIT Day – Markets Becalmed – Gold Panic Prelude – Trading Hours
– Gold Lower Despite “Panic” Due To “Supply Issues” In Inter Bank Gold Market
– Gold Slips Despite UK Gold Demand Surging – Investors “Seek Stability”
– Gold Prices Surge to Highest in Nearly Two Years On FED and Brexit Haven Demand
– Gold Bullion Has Little Downside, Brexit Or Not, Says HSBC
– Central Bank of Ireland Warns Risks are Debt, Brexit, Geopolitical Tensions and Migration
– Gold In Euros Surges 6.5% In June and 17% YTD On BREXIT Concerns
– Soros Buying Gold On BREXIT, EU “Collapse” Risk
– UK Gold Demand Rises On BREXIT “Nerves”
– Pensions Timebomb in “Slow Motion Detonation” In UK, EU, U.S.
– Silver – Perfect Storm Brewing in the Market

Tuesday, July 5, 2016

"In Gold We Trust" Annual Report Shows New Bull Market "Emerging"

Published here: http://redirect.viglink.com?u=http%3A%2F%2Fwww.zerohedge.com%2Fnews%2F2016-07-05%2Fgold-we-trust-annual-report-shows-new-bull-market-emerging&key=ddaed8f51db7bb1330a6f6de768a69b8

The "In Gold We Trust" Annual Report by fund managers, Ronald-Peter Stöferle and Mark Valek has just been published and is as ever essential reading for all seeking to better understand the gold market.

Inline image 1

Last year's report by Ronnie and Mark from Incrementum in Liechtenstein, was downloaded more than 1.5 million times and the report is now one of the most widely read gold studies in the world. The 170-page publication is as comprehensive as ever with many great tables and charts. It concludes that a new gold "bull market is emerging."

- Gold is back, a new bull market is emerging
- Increasing uncertainty about economic and political developments boosts the gold price
- Monetary stimulus ongoing: the BoJ and the ECB are creating the equivalent amount of the world's entire annual gold production via their QE programs each month
- BREXIT: Uncertainty will negatively affect growth. Further monetary and fiscal stimulus to be expected to counter further disintegration of the Union
- Dollar strength upon US-recovery and normalization was major contributor to gold/commodity weakness of the last years
- The narrative of economic recovery is crumbling; US recession cannot be ruled out; faith in monetary policy measures declines
 
- Continued depreciation of the US dollar and strength in commodities may lead to higher inflation, or maybe stagflation
- The persisting low interest rate environment is leading to a revival in interest in gold investments on the part of institutional investors
- In addition to gold, this generally means a positive environment for inflation-sensitive assets like silver and mining stocks
- Incrementum confirms its long-term price target of USD 2,300 for June 2018 - New Gold "Bull Market Is Emerging
 
 
The full report can be read here 
 

7RealRisksBanner


Gold and Silver News
China buyers drive silver prices higher (WSJ)
Silver crushes even gold as it powers to 2-year high (Marketwatch)
Gold retreats, correction seen short-term (Reuters)
Still stronger gold price ahead (Credit Suisse)
Precious Metals Shine Bright for Brexit Haven Seekers (Bloomberg)
Gold pushes back towards 2 year high, silver crosses $21oz (Reuters)
Is Gold the Answer to Negative Rates and Brexit Woes? (Bloomberg)

ETF Securities Reports Biggest One-Day Gold Inflow Since Financial Crisis (Zerohedge)
Bear Stearns 2.0? UK's Largest Property Fund Halts Redemptions, Fears "Vicious Circle" (Zerohedge)
Detonation of the LBMA - It Wasn't Brexit, Governor Carney (Safehaven)
Read More Here

Gold Prices (LBMA AM)
05 July: USD 1,344.75, EUR 1,207.05 & GBP 1,023.89 per ounce
04 July: USD 1,348.75, EUR 1,213.07 & GBP 1,016.42 per ounce
01 July: USD 1,331.75, EUR 1,199.51 & GBP 1,001.34 per ounce
30 June: USD 1,317.00, EUR 1,183.59 & GBP 976.82 per ounce
29 June: USD 1,318.00, EUR 1,191.64 & GBP 984.36 per ounce
28 June: USD 1,312.00, EUR 1,185.79 & GBP 985.84 per ounce
27 June: USD 1,324.60, EUR 1,200.49 & GBP 996.36 per ounce

Silver Prices (LBMA)
05 July: USD 19.73, EUR 17.69 & GBP 14.99 per ounce
04 July: USD 20.36, EUR 18.31 & GBP 15.36 per ounce
01 July: USD 19.24, EUR 17.29 & GBP 14.48 per ounce
30 June: USD 18.36, EUR 16.48 & GBP 13.61 per ounce
29 June: USD 18.21, EUR 16.42 & GBP 13.55 per ounce
28 June: USD 17.57, EUR 15.84 & GBP 13.17 per ounce
27 June: USD 17.70, EUR 16.06 & GBP 13.40 per ounce

Recent Market Updates

- 3 Charts Show "How Precious Brexit Is" for Gold and Silver Bullion
- Gold, Silver Best Performing Assets In H1, 2016 – Up 26% & 38%
- BREXIT Creates EU Contagion Risk – Ramifications for Investors, Savers and Companies In Ireland
- BREXIT Day – Markets Becalmed – Gold Panic Prelude – Trading Hours
- Gold Lower Despite “Panic” Due To “Supply Issues” In Inter Bank Gold Market
- Gold Slips Despite UK Gold Demand Surging – Investors “Seek Stability”
- Gold Prices Surge to Highest in Nearly Two Years On FED and Brexit Haven Demand
- Gold Bullion Has Little Downside, Brexit Or Not, Says HSBC
- Central Bank of Ireland Warns Risks are Debt, Brexit, Geopolitical Tensions and Migration
- Gold In Euros Surges 6.5% In June and 17% YTD On BREXIT Concerns
- Soros Buying Gold On BREXIT, EU “Collapse” Risk
- UK Gold Demand Rises On BREXIT “Nerves”
- Pensions Timebomb in “Slow Motion Detonation” In UK, EU, U.S.
- Silver – Perfect Storm Brewing in the Market
- Martin Wolf: There Will Be Another “Huge” Financial Crisis

Monday, July 4, 2016

Three Charts Show How Precious Brexit Is for Gold and Silver

Published here: http://redirect.viglink.com?u=http%3A%2F%2Fwww.zerohedge.com%2Fnews%2F2016-07-04%2Fthree-charts-show-how-precious-brexit-gold-and-silver&key=ddaed8f51db7bb1330a6f6de768a69b8

Gold and silver have been the standout winners in the fallout from Britain’s decision to leave the European Union according to Bloomberg. They have compiled three charts showing how “precious” Brexit is for gold and silver.

Brexit_gold_silver

Investors seeking a haven from volatile currencies and equities pushed prices of the metals to a two-year high. With central banks pledging more stimulus to prop up markets (the Bank of England may cut interest rates within months and traders have reduced odds on the Federal Reserve raising rates), the appeal of owning non-yielding assets like precious metals has increased.

Gold has climbed 6.2 percent and silver 11 percent since the June 23 referendum, outperforming global stocks, bonds and currencies, including those also often bought as a haven.

“Macroeconomic risk and geopolitical risk were already setting gold and silver up for a good year – the Brexit fall out has just been the icing on the cake,” said Mark O’Byrne, a director at brokerage GoldCore Ltd. in Dublin. “These metals will continue to outperform as market conditions remain unstable.”

See full article here

7RealRisksBanner


Gold and Silver News
Gold Climbs 1.3% on Week and Silver Soars 10.1% (Coin News)
Gold inches up, silver passes $20 threshold at near 2-yr highs (Reuters)
Gold Posts Longest Run of Gains in Two Years on Stimulus Bets (Bloomberg)
Silver scores biggest weekly jump in almost 3 years (DJ Marketwatch)
Gold heads for fifth week of gains and silver soars (Reuters)

Best And Worst Performing Assets In June And Q2 (Zerohedge)
How the UK’s vote affected Irish shares, sterling, bond prices and safe-haven gold (Irish Times)
Precious Metal Pandemonium – Silver Spikes Limit-Up, Gold Surges As China FX Basket Hits Record Low (Zerohedge)
500 Tons of Gold That Show Global Rise in Investor Angst (Bloomberg)
Read More Here

Gold Prices (LBMA AM)
04 July: USD 1,348.75, EUR 1,213.07 & GBP 1,016.42 per ounce
01 July: USD 1,331.75, EUR 1,199.51 & GBP 1,001.34 per ounce
30 June: USD 1,317.00, EUR 1,183.59 & GBP 976.82 per ounce
29 June: USD 1,318.00, EUR 1,191.64 & GBP 984.36 per ounce
28 June: USD 1,312.00, EUR 1,185.79 & GBP 985.84 per ounce
27 June: USD 1,324.60, EUR 1,200.49 & GBP 996.36 per ounce
24 June: USD 1,313.85, EUR 1,181.28 & GBP 945.58 per ounce

Silver Prices (LBMA)
04 July: USD 20.36, EUR 18.31 & GBP 15.36 per ounce
01 July: USD 19.24, EUR 17.29 & GBP 14.48 per ounce
30 June: USD 18.36, EUR 16.48 & GBP 13.61 per ounce
29 June: USD 18.21, EUR 16.42 & GBP 13.55 per ounce
28 June: USD 17.57, EUR 15.84 & GBP 13.17 per ounce
27 June: USD 17.70, EUR 16.06 & GBP 13.40 per ounce
24 June: USD 18.04, EUR 16.32 & GBP 13.18 per ounce

Recent Market Updates
– BREXIT Day – Markets Becalmed – Gold Panic Prelude – Trading Hours
– Gold Lower Despite “Panic” Due To “Supply Issues” In Inter Bank Gold Market
– Gold Slips Despite UK Gold Demand Surging – Investors “Seek Stability”
– Gold Prices Surge to Highest in Nearly Two Years On FED and Brexit Haven Demand
– Gold Bullion Has Little Downside, Brexit Or Not, Says HSBC
– Central Bank of Ireland Warns Risks are Debt, Brexit, Geopolitical Tensions and Migration
– Gold In Euros Surges 6.5% In June and 17% YTD On BREXIT Concerns
– Soros Buying Gold On BREXIT, EU “Collapse” Risk
– UK Gold Demand Rises On BREXIT “Nerves”
– Pensions Timebomb in “Slow Motion Detonation” In UK, EU, U.S.
– Silver – Perfect Storm Brewing in the Market
– Martin Wolf: There Will Be Another “Huge” Financial Crisis

Fireworks: Silver SOARS … Gold Roars!

Published here: http://redirect.viglink.com?u=http%3A%2F%2Fwww.zerohedge.com%2Fnews%2F2016-07-04%2Ffireworks-silver-soars-%25E2%2580%25A6-gold-roars&key=ddaed8f51db7bb1330a6f6de768a69b8

July 4 - Gold $1350.40 up $13.70 - Silver $20.40 up 86
cents
(Last prices over prior Comex close)


Fireworks: Silver SOARS … Gold Roars!


"The gold
price manipulation scheme will go
down as the biggest financial market scandal in U.S.
history."
— Bill Murphy, Chairman of the Gold Anti-
Trust Action Committee


Brad Hoppmann
Publisher, Uncommon Wisdom Daily


Simply click
this link for all the details
.


GO
GATA!

Last night was something else and a sign of the times for
what will be standard fare for the precious metals over the
months ahead.

After the briefest of dips, silver popped a dime and then
began to steadily move up to take out $20 an ounce. Once
that level was breached, all heck broke loose. Silver began
a run higher rarely ever seen. Its price moved up and up and
then began trading EXACTLY like gold did the evening
following the Brexit vote, shooting up ten cents at a click.
Just as gold soared to only pennies less than a gain of $100
an ounce at that time, silver rose $1.50 over its prior
Comex close and blew through $21 to $21.13 in the process.

Excitement would be an understatement. Gold was acting
sluggish at the time, but then caught some fire, as silver
finally did briefly following that gold post Brexit run, by
rising to $1356. Both precious metals corrected, giving up
most of their gains, but then began to move right back up
again as the trading hours in London progressed. In a
relative blink silver was back to $20.50 with gold back
above $1350.

"Can’t tell the players without a scorecard,"
is an old sports expression we used as kids.

While watching the action last night in the silver price
arena was exhilarating, it probably is no surprise to
Café members in that it has all been laid out over
the past two weeks. Now that what has been discussed is
playing out almost as part of a script, it is time to really
pound the table about what the silver price is in the
process of doing, and that is a historic move towards $100
an ounce and probably at lightening speed. The lack of
comprehension and enthusiasm by the general public of what
is occurring is astounding.

Some retro MIDAS comments for focus purposes:

June 23 - Gold $1261.20 down $6.80 - Silver $17.35 up 4
cents

An emphasis in this column for some time now has been on
the "whacked out" silver price action. Never seen anything
like it over the past 40 years. And now, after all that
focus, the silver OI confirms that something "wacky"
(profound?) is indeed making itself felt in the silver
market … and that STRANGE is being reflected in the silver
open interest itself.

I was very fortunate in my early commodity trading days
to be a part of spotting situations such as what I think I
see developing in the silver market via the genius of some
big time market legends…

*Dan Ritchie, former CEO of Westinghouse Broadcasting who
turned down running the empire of the richest man in the
world at the time DK Ludvig; and turned down an offer from
Harvard to be their chancellor to take that same position at
Denver University. Dan made fortunes trading cattle, hogs,
pork bellies and soybeans by spotting the mega moves before
most anyone else.

*Ray Dalio, who has become the number one hedge fund
manager in the world. Ray’s acumen in spotting the big moves
began to take hold way back in late 1970’s and 1980’s.
Veteran Café members will recall his feeder
cattle/corn/cattle profit margin trade (and the reverse)
which always made 100% within a month (usually within a
week) every time we put it on.

*Frank Veneroso, who wrote The Gold Book, and was
instrumental to bringing GATA’s attention to The Gold Cartel
because of their secretive gold lending operations via the
central banks. In 1987 Frank realized the investment world
was failing to take into account all the copper demand
emanating from Asia. In 9 months the copper price went from
46 cents a pound to $1.46.

Will never forget the ah-ha moment in early May of 1987
with copper trading under 50 cents. There were NO
deliveries, which no one expected, and it was off to the
races. By the time most investors caught on, copper was over
75 cents per pound.

What each of them had in common was to spot what was
REALLY going on in a commodities market before most anyone
else. They were visionaries in that sense and that is how
they could spot coming MEGA moves WAY before the herd showed
up. They paid attention to details, when few others were,
which foretold what the big picture was going to look like
price-wise in the near future … and they made big bets with
their own money.

SO, based on the sort of market analysis they taught me
so long ago, it is time to jump up and down and suggest that
the historic move up in silver, which we are waiting for, is
finally in play. Predicting the exact moment when the silver
plug will be pulled is impossible. But, based on all the
unusual anecdotal happenings which seem to confirm each
other, the time bomb clock is ticking MUCH LOUDER. If this
is correct, the silver price explosion is not far off. Very
few in the investment world are prepared for the coming
fireworks…

***

How appropriate to have such fireworks really commence on
our July 4th celebration day. There are much more
spectacular ones to light up the scoreboard as this year
progresses.

Ah, what fun to watch. Now for some commentary written
on Saturday in preparation for today…

On the open interest front the gold
"Preliminary" open interest numbers show a 23,749
contract increase to 644,984, which if even coming close in
the "Final" number, puts it only thousands of
contracts off of its all-time higher number around 650,000.
And this is with the lowly price of gold not even above
$1350. The silver open interest Preliminary number also
shows a hefty increase, up 4782 contracts to 216,311, which
means it too is just a tad below its recent all-time high.

The latest guesstimate OI numbers reveal a couple of
critical observations…

*How intent The Gold Cartel is to prevent the gold/silver
prices from going to where they want to go and how much
trouble they are having right now preventing them from doing
so.

*Their obvious growing desperation. As such, it strongly
suggests THEY are in a quickly developing process of
finally reaching that Tipping Point in which their
price suppression efforts are overrun. Dynamic demand forces
are overpowering their dwindling physical supply to stop the
inevitable.

Silver is worth pounding the table focus at the moment
because of the increasing odds the beginning of one of the
most unusual moves in market history is now (finally) in
play. For repeat emphasis purposes the deal (supposition on
my part) is this…

*The price of silver has been suppressed as a monetary
metal to enhance The Gold Cartel’s efforts of the gold price
for the many reasons discussed here for the last 17+ years.

*The ringleader behind the scene is the U.S. Government,
with their number one key agent over all this time: JP
Morgan, the acknowledged Fed’s bank. It has long been
discussed that JP Morgan took over Bear Stearn’s massive
silver short position when Bear blew up. My take on it all
is that the Bear position was at the behest of our
government, or a trading group acting as an agent for, or in
sync, with The Gold Cartel. Stunned by the Bear collapse,
THEY went into emergency mode, shifting that position to the
safest of hands, JP Morgan.

*JP Morgan has honchoed the short silver operation on
behalf of The Gold Cartel ever since and taken it into
higher gear with their MASSIVE selling of silver futures,
taking it to all-time high levels.

*Based on all what has been brought your way the past two
weeks in this commentary, the thought here has been that JPM
and The Gold Cartel have reached a stage when they are
beginning to operate on physical silver supply fumes.

The smart guys in our camp in line with the GATA type of
thinking/analysis, have not been able to figure out where
the physical silver supply has been coming from to meet
demand at such pitifully low price levels. However it was
done, that available supply may be quickly disappearing.

*There is a very good chance that some VERY big money
buyers have moved in to squeeze The Gold Cartel and make a
huge fortune by doing so … first by getting to all-time high
long positions in the futures market and then by buying up
the remaining available physical supply as best they can.

*If all of the above is the case, or close to it, then it
explains The Tipping Point price action we saw last week,

The technical silver chart picture supports what is very
likely to be a historic silver price move to the upside,
which at times trades in volatile price action higher rarely
ever seen before.

The daily chart shows the powerful outside day price
reversal to the upside immediately following the Brexit
surprise. Once silver was able to close above the neckline
of its prominent reverse head and shoulders formation at
$18,
it was ready to move…

However, the big picture real key was at $18.50, which
proved out on Friday … the reason being is that a move above
$18.50 meant the completion of a massive base formation,
with no short term minor resistance until the price rises
to a little above $21…

It is the monthly chart, which did not include Friday’s
dramatic surge, which sets up what is coming for the price
via a technical picture. Important technical resistance
doesn’t surface until $25 and then $35 an ounce. But the
most exciting aspect of reviewing this chart is that IF the
simple fundamental analysis put forth here is correct, it
shows how fast the price of silver can move up when it is a
"go."

My bet is that silver is so explosive that it will move
up faster than it did in late 2010/early 2011 to reach $50.
The third time being the charm (the first in 1980), silver
will take out $50 this time and shoot for $100…

***

And here we are two days later…

A Comprehensive Look at the Silver Market (Video)

Published here: http://redirect.viglink.com?u=http%3A%2F%2Fwww.zerohedge.com%2Fnews%2F2016-07-04%2Fcomprehensive-look-silver-market-video&key=ddaed8f51db7bb1330a6f6de768a69b8

By EconMatters


We do a deep technical dive into the Silver Market now that it has officially broken out, and has the potential to do something special if market forces align correctly for the precious metal.


© EconMatters All Rights Reserved | Facebook | Twitter | YouTube | Email Digest | Kindle    

Sunday, July 3, 2016

After Brexit, This Will Be Next

Published here: http://redirect.viglink.com?u=http%3A%2F%2Fwww.zerohedge.com%2Fnews%2F2016-07-03%2Fafter-brexit-will-be-next&key=ddaed8f51db7bb1330a6f6de768a69b8

QE

You have probably already read dozens of articles and op-ed’s about the Brexit vote and its impact on the political landscape in Europe. The markets completely crashed ‘the day after’ but quickly regained their composure and the losses of 5-8% at the opening bell were quickly erased.

Brexit 3

Source: Stockcharts.com

Now, just one week later, most indices are trading at higher levels than right before the Brexit, and everything seems to be forgiven and forgotten, especially as nor David Cameron nor the potential future prime minister seem to be keen to trigger the now-famous Article 50 in the European Treaty. This means it’s very unlikely a ‘Brexit’ will be completed before the end of this decade.

And that’s exactly what financial markets used to hate; the simple fact there’s absolutely no visibility about how the European block will look like just one or three years from now will definitely have a negative impact, and that’s also exactly what the IMF has been warning for. IMF-boss Lagarde called the potential Brexit (it’s still just a chance, nothing has been effectively decided yet) an ‘immediate threat to the world economy’ and ‘putting the UK on the brink of a recession’. (yes, she did use the R-word)

She also warned the recovery from the Global Financial Crisis is going way too slow and is too fragile’, and whereas this sort of message would be seen as bad news in any world dominated by common sense, the markets quickly became optimistic again, as the rate hikes will now be completely off the table whilst another round of Quantitative Easing is back on that same table.

In a relatively long working paper, released by the Bank of England, Mark Carney tries to soften the blow by explaining how well-capitalized the British Banks are, as the capital requirements are now ten times as strict compared to before the financial crisis in 2008.

Brexit 1

Source: Bank of England

However, the uncertainty regarding the economic policy in the UK hasn’t been this high in the past two decades. Even during the Global Financial Crisis and Euro-crises the uncertainty was lower than what we’re seeing now, as you can see on the previous image.  The uncertainty will cause consumers to start hoarding more cash instead of deploying it in the market. Again from the Bank of England:

‘As a result of increased uncertainty and tighter financial conditions, UK households could defer consumption and firms delay investment, lowering labour demand and causing unemployment to rise. Through financial market and confidence channels, there are also risks of adverse spillovers to the global economy. Over the coming weeks, the Bank will consider a host of other measures and policies to promote monetary and financial stability.’

BRexit 2

Source: Stockcharts.com

Reading between the lines, you can expect the Bank of England starting a substantial program of Quantitative Easing to calm the rattled markets, and that’s the main (and probably only) reason why the main indices are currently trading higher (the FTSE 100 is trading almost 3% higher than before the surprising leave-vote) than right before the Brexit. The yield on the 10-year UK Gilt’s and even the 10 year rate on the US treasuries have reached decade-lows, indicating the market is expecting the interest rates to go down, rather than to go up.

>>> Read our guide to gold right now!

Secular Investor offers a fresh look at investing. We analyze long lasting cycles, coupled with a collection of strategic investments and concrete tips for different types of assets. The methods and strategies are transformed into the Gold & Silver Report and the Commodity Report.

Follow us on Facebook @SecularInvestor [NEW] and Twitter @SecularInvest

Gold, Silver Best Performing Assets In H1, 2016 – Up 26% and 38%

Published here: http://redirect.viglink.com?u=http%3A%2F%2Fwww.zerohedge.com%2Fnews%2F2016-07-03%2Fgold-silver-best-performing-assets-h1-2016-%25E2%2580%2593-26-and-38&key=ddaed8f51db7bb1330a6f6de768a69b8

Gold, Silver Best Performing Assets In H1, 2016 – Up 26% and 38%

Gold and silver are the best performing assets in H1, 2016 and saw gains of 26% and 38% respectively. They were the best performing assets prior to Brexit and they are the best performing assets since Brexit. Gold and silver are up 6% and 11% respectively since the seismic Brexit vote led to turmoil on global markets.

SIlver_gold_YTD_2016
Market Performance, H1, 2016 (Finviz.com)
 

Global stocks had a torrid first half with European and Asian stocks coming under severe selling pressure. The Euro Stoxx 50 fell 10.4%. The Nikkei was down a whopping 17%, while the Shanghai A shares was down by even more – nearly 20 percent. U.S. shares remained elevated – largely due to continuing zero percent interest policies (ZIRP) by the Federal Reserve – contrary to all the speculative, nonsense talk of the Fed rising rates.

Gold and silver made gains due to continuing ultra loose monetary policies, diminished U.S. rate-increase expectations, worries about global economic growth, both U.S. and global geopolitical concerns and turmoil in markets at the start of Q1 and again at the end of Q2.

The UK decision to leave the EU has exacerbated these risks and highlighted them for complacent western speculators and investors who seemed blissfully unaware of the growing geopolitical and macroeconomic risks.

The case for gold and silver was already bullish prior to Brexit. Brexit is the “icing on the cake” and means that the fundamentals for gold and silver are arguably as good now as they have were in the early 1970s and the early 2000s.

The smart money knows this and this is seen in the likes of Soros, Dalio, Druckenmiller and many of the world’s largest financial institutions and indeed insurance companies allocating to the financial insurance that is gold in recent months.

While Brexit is “icing on the cake” for the precious metals, for the financial system, it may be the proverbial “straw that breaks the camel’s back.”

The global financial and monetary system has all the appearances of a very old camel that is on its last legs. Copious amounts of drugs have been pumped into the camel in recent years which has prolonged its miserable life by a few years. But, they have not dealt with the substantive issue of the camel’s very old age. Similarly we have not dealt with the substantive issue of a global financial system that is drowning in trillions and trillions of dollars, euros, pounds etc of debt – some $60 trillion of which has been created since 2008.

Brexit highlights the vulnerability of the Eurozone, the Eurozone banking system and the real potential for contagion in the global financial system.

There is the inconvenient truth that many European banks – French, Italian and Irish for example – remain woefully under capitalised and indeed are border line insolvent. It is not just banks in the unfortunate “PIIGS” that are vulnerable. A cursory glance of the share price of Germany’s Deutsche Bank and Switzerland’s Credit Suisse should give even the most complacent and ‘Pollyannish’, tunnel vision bull pause for concern.

The head of Germany’s financial regulatory authority has sounded the alarm on the real risks Brexit poses to large German banks. Two banks cited as having the largest financial dealings in London are Deutsche Bank (NYSE:DB) and Commerzbank (OTC:CRZBY), with shares of Deutsche breaking to new all-time lows in recent days.

A British vote to leave the European Union would hit large German banks, given their heavy exposure to London, the head of German financial watchdog Bafin said in an interview with German newspaper Tagesspiegel as reported by Reuters. Bafin President Felix Hufeld told the newspaper that if there was a Brexit – “the biggest banks would have the biggest problems … they have the most activities in, and with, London,” he said.

Both Deutsche and Credit Suisse have massive derivative books and exposure and the bankruptcy of either one could lead to the EU’s ‘Lehman moment.’ Indeed, it could contribute to the collapse of the ‘single’ currency and indeed the global banking system. To those who say that this could not happen, it is worth remembering – lest we forget – that we came very, very close to that just eight short years ago.

Yet, the root cause of the initial crisis – insolvent banks and an insolvent world – has not been addressed since then. Indeed the financial position of banks and much of the western world today is arguably much worse than it was in 2008.

Gold and silver are reflecting the fact that we have a massive global financial bubble, especially in western bond markets and arguably in the U.S. stock market. This huge bubble is based on ultra loose monetary policies and the creation of currency to artificially support and pump up to record highs global bond markets. The bubble is beginning to unravel before our eyes.

The global financial system is a complete mess and the drum beat of bank bail-ins and currency devaluations grows louder by the day. Gold and silver have protected investors so far in 2016, as they have done throughout history and will do in the coming years.

Gold and Silver News
Gold holds overnight gains, heads for fifth weekly gain (Reuters)
Gold Advances for Fifth Week as Central Banks Poised for Easing (Bloomberg)
Gold bulls buoyed by prospect of Brexit swaying Fed (Reuters)
London gold trade agrees reforms to boost transparency (Reuters)
JPMorgan beats traders in silver futures rigging lawsuits (Reuters)

Gold Miners’ Debt Hangover Eases as Bullion Gets Brexit Boost (Bloomberg)
Cheap Gold Mines Disappear as Buyers Splurge for Surging Bullion (Bloomberg)
British bonds go negative as Bank of England plans more money creation (FT via GATA)
Brexit won’t hit global growth, but it does make one big difference (Money Week)
Brexit Fever Spreads: Austria and Holland are Next Up to Leave EU (Gold Seek)
Making The Case For $12,000 Gold And $360 Silver (Silver Seek)
Read More Here

Gold Prices (LBMA AM)
01 July: USD 1,331.75, EUR 1,199.51 & GBP 1,001.34 per ounce
30 June: USD 1,317.00, EUR 1,183.59 & GBP 976.82 per ounce
29 June: USD 1,318.00, EUR 1,191.64 & GBP 984.36 per ounce
28 June: USD 1,312.00, EUR 1,185.79 & GBP 985.84 per ounce
27 June: USD 1,324.60, EUR 1,200.49 & GBP 996.36 per ounce
24 June: USD 1,313.85, EUR 1,181.28 & GBP 945.58 per ounce
23 June: USD 1,265.75, EUR 1,112.22 & GBP 850.96 per ounce

Silver Prices (LBMA)
01 July: USD 19.24, EUR 17.29 & GBP 14.48 per ounce
30 June: USD 18.36, EUR 16.48 & GBP 13.61 per ounce
29 June: USD 18.21, EUR 16.42 & GBP 13.55 per ounce
28 June: USD 17.57, EUR 15.84 & GBP 13.17 per ounce
27 June: USD 17.70, EUR 16.06 & GBP 13.40 per ounce
24 June: USD 18.04, EUR 16.32 & GBP 13.18 per ounce
23 June: USD 17.29, EUR 15.16 & GBP 11.61 per ounce

Recent Market Updates
– BREXIT Day – Markets Becalmed – Gold Panic Prelude – Trading Hours
– Gold Lower Despite “Panic” Due To “Supply Issues” In Inter Bank Gold Market
– Gold Slips Despite UK Gold Demand Surging – Investors “Seek Stability”
– Gold Prices Surge to Highest in Nearly Two Years On FED and Brexit Haven Demand
– Gold Bullion Has Little Downside, Brexit Or Not, Says HSBC
– Central Bank of Ireland Warns Risks are Debt, Brexit, Geopolitical Tensions and Migration
– Gold In Euros Surges 6.5% In June and 17% YTD On BREXIT Concerns
– Soros Buying Gold On BREXIT, EU “Collapse” Risk
– UK Gold Demand Rises On BREXIT “Nerves”
– Pensions Timebomb in “Slow Motion Detonation” In UK, EU, U.S.
– Silver – Perfect Storm Brewing in the Market
– Martin Wolf: There Will Be Another “Huge” Financial Crisis

Own gold and silver coins and bars in the safest way possible with GoldCore


Saturday, July 2, 2016

How to make fireworks in your account

Published here: http://redirect.viglink.com?u=http%3A%2F%2Fwww.zerohedge.com%2Fnews%2F2016-07-02%2Fhow-make-fireworks-your-account&key=ddaed8f51db7bb1330a6f6de768a69b8

While most of the US population drowns in a prolonged semi-conscious state for several days, with moments of alertness (they'll know they are alive when they see the fireworks) - the remaining force of human intelligence on the planet, spends time trying to figure out ways to break through this vast blanket of social control that's been thrown over the population like a sticky net, which is slowly eating away at the global standard of living, overall quality, lowering human genetic value.  Each day, our money is worth less and less.  Why?  We explain this in Splitting Pennies - Understanding Forex.

The problem with much discussion on Zero Hedge and alternative media in general, is that it lacks a conclusion and proposed solution.  So, we mostly agree that the USD is toast, there's an insurmountable debt that cannot be paid back (because in a debt-based money system, if the debt is paid off, money will cease to exist).  Gold is the go to alternative to stocks & bonds which are mostly overrated - but then what?  So let's say Gold hit's $50,000 USD per ounce.  Then what?  Well for one, be sure that you have some good security because in a crisis, the only real currency is accelerated lead, as elaborated here eloquently.

So what is an investor to do?  Fundamental analysis of markets is impossible, because of reasons outlined well on this site:

1) Market data is manipulated heavily.  By the time any investor receives market information (unless he's paying for a front running service) one can assume it's been seen by leading market controllers, HFTs, directors of various unsundry government organizations, and George Soros.

2) The world changes too rapidly for any fundamental strategy to play out.  Too many wildcard events can derail strategies such as value investing.  Brexit is a great example - and there will be many more "Brexits."

3) Even if the above 1 & 2 didn't exist, an investor would need a carrying broker that was fair and honest, and would provide decent execution, and not go out of business.  With investing strategies such as some which are discussed on this site, this is a big issue.  For example, if Gold is $50,000 let's say that GLD goes bust, and starts a chain reaction on exchange listed ETFs and ETNs, which can't possibly fullfill their underlying liquidity obligations even in currenct conditions, not in extreme conditions.  Could it bring down some BDs with them?  SIPC is limited (..and if it were a TD Ameritrade, no insurance in the world can cover it).  So with such extreme strategies, counterparty risk is very large - especially in such climates that would make extreme strategies flourish.  Florida residents know very well how this works, when a big Hurricane strikes, the majority of underwriters for flood & Hurricane insurance go bust (FL law or mortgage policy sometimes require residents carry "Hurricane" insurance which doesn't cover "flood" damage).  If the markets melt down, as many claim - how many brokers would go bust?  How many leveraged banks?  Some big banks are not looking good (such as DB - $54 - $75 Trillion derivative bomb), even in this ideal banking climate.

Hoarding a 6 month supply of food, and living in an underground bunker, is not a real solution.  Having a bug out bag, ammo, gold bars & silver coins, and other paraphernalia, it's just survival.  It's not a strategy.  Keeping Gold is the investing equivalent of being a prepper.  And as we've explained in a previous detailed article, preppers have it all wrong.

Algorithmic Trading - The New Asset Class

This is one solution - and likely will soon be an entire asset class by itself.  Robo-Advisors are becoming popular in securities, but on the surface it seems they are only SAS solutions that are replacing human office workers.  They are just doing the job that the office worker RIA used to do; meet with clients and build a vanilla portfolio with 20% Utilities and 50% Technology and 20% "Growth" (whatever that ever meant) and 10% Dividend stocks.  Currently, HFT is dominated by large institutional players that frankly, the public knows very little about.  See one example Jump Trading.  The problem is their inaccessability - investors will need many millions to start (consider $50 Million, for a good start).  Also, having the $50 Million doesn't qualify you for anything.  Now you'll have to develop your own algorithms, or hire another firm to do it.  But this is the equivalent of hiring a consultant to tell you what business you are in (Consultants, and lawyers, will do this for a fee).

Then there's the world of retail algorithmic Forex, not allowed for US investors (or at least, so highly restricted and regulated it makes any normally profitable strategy, barely profitable).  As this chart shows, it really is "Magic:"

The above is a real live trading account over a period of 3 years.  Not likely that an investor can find such performance in stocks, or 'robo advisors.'  

The point is that an algorithm can trade any market, and if the strategy is stable, and consistent, it can deliver investment returns above and beyond the average, that are not correlated to the market - and most importantly - NOT DEPENDENT ON HUMAN BEINGS.  An algorithm isn't perfect, but it solves the basic fundamental problems of human traders.  And there are thousands of them.  You can even evaluate FX algorithms for free, without investing a penny.  Checkout www.getfxliquidity.com as one example - there are many.  To learn more about investing in Forex checkout Fortress Capital Forex here. 

Algorithms give developers many abilities that simply wouldn't be possible with human traders.  Most importantly, in a sterile development environment, it's possible to test, analyze, and optimize any trading idea relatively quickly, and then develop a robust strategy based on this process.  It's necessary to invest heavily in computing to do this, but many who have done this will offer their strategies for investors use.  What's good about this approach is that it's an investment in a methodology, not in an asset class. 

This is a fundamental mistake made by modern investors.  Gold is great.  But then what?  During Brexit for example, it was possible to buy and sell the Great British Pound by more than 10 signficant moves, during a 10 hour period.  That's activity that an algo can capture.  Just 'investing' in the US Dollar, or Great British Pound - is risky.  If an algo is built with a robust risk management module, it's the safest way to trade the markets.  And one doesn't need to become an expert in mathematics and algorithm development to do so - there are hundreds of algos available for use by any investor, big or small.  But if one does want to take on a challenge and build his own investing system, there are literally thousands of free resources online to support that development.  There's companies that have built a business out of algorithm development.  And certainly, this is only the beginning of a new blue ocean market.  The reason algos are the future?  Because they work.  That's all.

Friday, July 1, 2016

Bullion coin sales of major Mints prop up Government revenues

Published here: http://redirect.viglink.com?u=http%3A%2F%2Fwww.zerohedge.com%2Fnews%2F2016-06-30%2Fbullion-coin-sales-boon-worlds-largest-mints&key=ddaed8f51db7bb1330a6f6de768a69b8

The world’s major precious metals mints are currently riding high on the back of huge global bullion coin demand and relatively buoyant gold and silver prices. The sheer scale of revenues that the US Mint, Royal Canadian Mint (RCM), Perth Mint and Austrian Mint have been generating over the last number of years is eye-opening. These mints are predominantly run as commercial enterprises. Not surprisingly, due to their high value nature, revenues from bullion coin sales account for the lion’s share of total revenues for each institution and have been a core driver of their overall profitability.

Official Bullion Coin Programs

Each of these four mints has an official bullion coin program. The US Mint’s program consists of American Eagle Silver bullion coins, American Eagle gold bullion coins, American Buffalo gold bullion coins, America the Beautiful silver coins, and American Eagle Platinum coins. RCM's bullion coin program comprises gold, silver, platinum and palladium Maple Leaf bullion coins, as well as the recently added MapleGrams. The Perth Mint bullion program is slightly more extensive and briefly consists of the following: Australian Kangaroo gold and silver coin series, Australian Kookaburra silver coin series, Australian Koala silver coin series, Australian Platypus platinum coin series, Australian Lunar gold and Australian Lunar silver coin series. The flagship of the Austrian Mint's bullion program is the Vienna Philharmonic gold bullion coin series, but the mint also produces the Vienna Philharmonic as a silver and platinum bullion coin, as well as historical restrikes of original Austrian circulation gold ducats, gold guilders and gold crowns.  

Bullion Coin Sales Drive Revenues 

In fiscal 2015 (to September 30), the US Mint generated revenues of US$2.12 billion on its bullion coin sales. This represented 57.6% of the Mint’s total 2015 revenues of US$ 3.69 billion. Revenues from gold Eagles totalled $979.6 million, silver Eagle sales added $785.4 million, and gold American Buffalos contributed another $252.2 million in revenues.

In 2015, the RCM’s Gold Maple Leaf coin sales generated revenues of CA$1.41 billion while the Silver Maple Leaf coins added a further CA$687 million, giving a combined revenue of CA$2.1 billion. This represented over 80% of RCM’s total bullion revenues in 2015, and nearly 71% of RCM’s total 2015 group revenues.

The Austrian Mint’s annual report for 2015 is not out yet but will be published in early July. For calendar 2014, the Austrian Mint generated revenues of €1.14 billion. The biggest revenue contributors were gold bullion coin sales of €464.2 million and gold bar sales of €391.7 million. Together the Austrian’s Mint’s gold coin and bar sales represented a combined 75% of total mint revenues.

However, profit margins on the mints’ bullion coin sales are relatively small. For example, in fiscal year 2015, the US Mint only generated bullion income of $61.1 million on bullion revenue of $2.126 billion, so this was a margin of 2.87%. Nevertheless, it’s important to remember that the bullion sales of these mints, both in coins and bars, supply a global distribution network of precious metals wholesalers, bullion dealers and banks on the downstream side, as well as a chain of precious metals suppliers, refineries and gold miners upstream. Not to forget the ultimate beneficiaries of bullion sales, the investors and collectors. There is therefore an entire virtuous ecosystem built around the bullion coin output of these giant precious metals mints.

Furthermore, an often overlooked point is that with all four of these mints, profits from operations can and often do go to the mints’ owners in the form of either transfers or dividends. For three of the mints, their owners are governments. For the Austrian Mint it is owned by a government owned central bank, which is essentially the same thing.

Government Ownership and Dividends

The US Mint is part of the US Department of the Treasury, and reports to the Office of the Treasurer. The Mint is structured as a Public Enterprise Fund (PEF) under 31 U.S.C. § 5136 and generates its own revenues without the need for Federal appropriations. Any revenue that the US Mint deems to be excess to it’s needs is transferred to the Treasury General Fund.

For fiscal year 2015 (to September 30), the US Mint transferred $561 million to the Treasury General Fund, however $11 million of this was income from numismatic / bullion products, as the rest was a seigniorage transfer from the sale of circulating coins to the Federal Reserve Banks. But interesting, this $11 million can actually be used to reduce the US Treasury’s budget deficit.

The Royal Canadian Mint (RCM), a federal Crown corporation of the Government of Canada, is 100% owned by the Canadian Government and reports to the Canadian Department of Finance. Like the US Mint, the RCM is not funded by the Government and is predominantly run as a commercial organization except for the Canadian circulation coin program which since 2014 has been operated on a non-profit basis. Although the RCM made a small loss in fiscal 2015 (its year end is December 31) due to a one off impairment, it still paid dividends of CA$53 million to the Government of Canada which was a lot higher than previous years due to strong Maple Leaf coin sales.

The Perth Mint, through a holding company called Gold Corporation, is 100% owned by the Government of Western Australia. Western Australia is a state within the Commonwealth of Australia. The Perth Mint group operates on a fully commercial basis and is self-funding. In its fiscal 2015 results to June 30, the Mint made a profit after tax of AU$14 million and also paid a dividend of AU$10.54 million to the Government of Western Australia.

The Austrian Mint (Münze Österreich) is fully owned by Austria’s central bank, the Oesterreichische Nationalbank (OeNB). The OeNB’s capital is itself fully owned by the Austrian government. Although the Austrian Mint 2015 annual report is not yet published, the Austrian central bank has already reported that for 2015, it received a regular dividend of a cool €89 million from the Austrian Mint. In 2014, the Austrian Mint paid the central bank an even bigger dividend of €184.8 million out of its net profit.

Silver - Gold Production Ratio

The relative importance of gold and silver bullion coin sales varies across each mint and between years since each Mint’s bullion program differs, and demand patterns ebb and flow.

In 2015, the US Mint sold 801,500 ounces (24.93 tonnes) of gold American Eagles and 220,500 ounces (6.86 tonnes) of gold American Buffalos, for total gold bullion coin sales of 1,022,000 ounces (31.79 tonnes). Silver American Eagle sales reached 47 million ounces (1,461.85 tonnes) in 2015, with another 1,060,000 ounces (32.97 tonnes) of America the Beautiful 5 oz coins sold, bringing total US Mint silver bullion coin sales to 48.06 million ounces (1,494.82 tonnes).

Using a metric of silver ounces sold compared to gold ounces sold, this gives a silver to gold coin sales ratio of 47:1 for the US Mint. In 2015, the RCM sold 953,000 ounces of gold Maple Leaf bullion coins (29.6 tonnes), and 34.3 million ounces (1067 tonnes) of silver Maple Leaf bullion coins, giving a silver to gold coin sales ratio of 36 for the RCM. Therefore applied to 2015, it is justifiable for the US Mint to say that it was the world’s largest seller of gold bullion coins and silver bullion coins.

Although the Austrian Mint hasn’t published its full 2015 bullion sales statistics yet, it did reveal to Bloomberg earlier this year that its combined gold coin and gold bars sales for 2015 totalled 1.32 million ounces (41 tonnes), and its combined silver sales in 2015 totalled 7.3 million ounces (227 tonnes). This would give a general silver to gold ratio for the Austrian Mint of only 5.53, which highlights the Austrian Mint’s relative concentration on gold bullion over silver bullion. 

In 2014, the Austrian Mint sold 483,700 ounces (15 tonnes) of gold coins, mainly Vienna Philharmonics, and 410,364 ounces of gold bars (12.75 tonnes), Total gold sold was therefore 894,000 ounces (27.75 tonnes). The Mint’s silver coin sales approximated 144.4 tonnes of silver in 2014. This would give a silver to gold coin ratio of 9.63 and a silver coin to total gold (coins and bars) ratio of 5.2.

Overall, the world’s largest mints are a useful source of income for their government owners. More importantly though, these Mints actually make the valuable and high quality investment gold and silver coins and bars that are in such high demand right now, and that also provide tangible economic benefits such as employing large numbers of people around the world in highly skilled jobs. 


To learn more about the world's top Mints, please see full profiles of these Mints which have now been published on BullionStar's Gold University pages:

United States Mint: http://www.bullionstar.com/gold-university/united-states-mint

Royal Canadian Mint: https://www.bullionstar.com/gold-university/royal-canadian-mint

Perth Mint: http://www.bullionstar.com/gold-university/perth-mint

Austrian Mint http://www.bullionstar.com/gold-university/austrian-mint


Silver Surges 20% In Dollars and 28% In Sterling In June

Published here: http://redirect.viglink.com?u=http%3A%2F%2Fwww.zerohedge.com%2Fnews%2F2016-07-01%2Fsilver-surges-20-dollars-and-28-sterling-june&key=ddaed8f51db7bb1330a6f6de768a69b8

Silver has surged another 2.7% higher this morning to $19.23/oz. This after yesterday's 3% surge when silver flew through resistance at the $18 level to close at $18.26/oz. Silver is 20% higher in dollar terms in June. Silver has surged by similar amounts in euros and by 28% in beleaguered sterling in the month.

silver_July2016.jpg


Silver in USD - 10 Years

The rally for silver yesterday and today was more impressive than gold’s and saw prices at their highest since mid-September of 2014. Silver has now surged 20% in a month and the next level of resistance is $21.40/oz which silver touched in July 2014.

“Silver looks very bullish now and our clients are allocating to it in a big way,” we told Dow Jones Marketwatch (see below). “Silver is like gold on steroids when it gets going due to the very small size of the physical silver market versus stock, bond and even the gold market.”


Gold and Silver News
Gold settles near 2-year high; silver soars nearly 3% (Marketwatch)
“Silver looks very bullish now and our clients are allocating to it in a big way” (Marketwatch)
Biggest Gold ETF Tops Record as Angst Drives Inflows: Chart (Bloomberg)
Forget December. Forget Next Year. The Fed’s Done Hiking Until 2018 (Bloomberg)

Silver Surges To Post-Brexit Highs (Zero Hedge)
The Italians Need Some Gold! (Investor Intel)
Gold sending a dark sign that ‘almost everything has changed’ in market (Yahoo Finance)
Calm descends on markets – but for how long? (Money Week)
Read More Here

Gold Prices (LBMA AM)
30 June: USD 1,317.00, EUR 1,183.59 & GBP 976.82 per ounce
29 June: USD 1,318.00, EUR 1,191.64 & GBP 984.36 per ounce
28 June: USD 1,312.00, EUR 1,185.79 & GBP 985.84 per ounce
27 June: USD 1,324.60, EUR 1,200.49 & GBP 996.36 per ounce
24 June: USD 1,313.85, EUR 1,181.28 & GBP 945.58 per ounce
23 June: USD 1,265.75, EUR 1,112.22 & GBP 850.96 per ounce
22 June: USD 1,265.00, EUR 1,122.31 & GBP 862.98 per ounce

Silver Prices (LBMA)
30 June: USD 18.36, EUR 16.48 & GBP 13.61 per ounce
29 June: USD 18.21, EUR 16.42 & GBP 13.55 per ounce
28 June: USD 17.57, EUR 15.84 & GBP 13.17 per ounce
27 June: USD 17.70, EUR 16.06 & GBP 13.40 per ounce
24 June: USD 18.04, EUR 16.32 & GBP 13.18 per ounce
23 June: USD 17.29, EUR 15.16 & GBP 11.61 per ounce
22 June: USD 17.20, EUR 15.23 & GBP 11.72 per ounce

Recent Market Updates

- BREXIT Creates EU Contagion Risk – Ramifications for Investors, Savers and Companies In Ireland
- BREXIT Day – Markets Becalmed – Gold Panic Prelude – Trading Hours
- Gold Lower Despite “Panic” Due To “Supply Issues” In Inter Bank Gold Market
- Gold Slips Despite UK Gold Demand Surging – Investors “Seek Stability”
- Gold Prices Surge to Highest in Nearly Two Years On FED and Brexit Haven Demand
- Gold Bullion Has Little Downside, Brexit Or Not, Says HSBC
- Central Bank of Ireland Warns Risks are Debt, Brexit, Geopolitical Tensions and Migration
- Gold In Euros Surges 6.5% In June and 17% YTD On BREXIT Concerns
- Soros Buying Gold On BREXIT, EU “Collapse” Risk
- UK Gold Demand Rises On BREXIT “Nerves”
- Pensions Timebomb in “Slow Motion Detonation” In UK, EU, U.S.
- Silver – Perfect Storm Brewing in the Market
- Martin Wolf: There Will Be Another “Huge” Financial Crisis


www.GoldCore.com