Wednesday, July 13, 2016

Central Bank Wonderland is Complete and Now Open for Business — The Epocalypse Has Fully Begun

Published here: http://redirect.viglink.com?u=http%3A%2F%2Fwww.zerohedge.com%2Fnews%2F2016-07-13%2Fcentral-bank-wonderland-complete-and-now-open-business-%25E2%2580%2594-epocalypse-has-fully-begun&key=ddaed8f51db7bb1330a6f6de768a69b8

The following article by David Haggith was first published on the Great Recession Blog.

The Epocalypse has arrived

Summer vacation is here, and the whole global family has arrived at Central-Bank Wonderland, the upside-down, inside-out world that banksters and their puppet politicians call “recovery.” Everyone is talking about it as wizened traders puzzle over how stocks and bonds soared, hand-in-hand, in face of the following list of economic thrills: 


  • Britain voted to exit the EU, and a handful of other nations are talking openly along similar lines. One major crack in the European Union just happened, and others are forming. (Brexit is the name of this new Earthquake ride near the gates of Wonderland.)
  • Italy’s oldest bank (also the world’s oldest bank, Banca Monte dei Paschi di Siena) faces bankruptcy unless it gets bailed out. The bank that has survived the greatest tests of time (founded in 1472 before Columbus sailed the ocean blue) is going down unless it finds a savior! Italy’s prime minister is screaming for tax-payer bailouts. At the same time, one of Germany’s oldest banks and one of the largest — Deutsche Bank — has just about become a penny stock and faces the likelihood of imminent collapse if not bailed out, too. (Welcome to Wonderland’s zombie freak show of the world’s oldest walking-dead banks dying again.)
  • Gold and silver have been soaring as though people are fleeing to safety (in Wonderland’s Bouncy House of Coins).
  • People are also fleeing to safety in bonds, bringing the US 10-year bond down to a 1.318% yield, its lowest yield in history. (Hit me on the head with a hammer like a pop-up gopher, and watch me smile.)
  • In many nations around the world, government bonds have been selling hotter than bombs in Syria even with negative interest rates, meaning you lose money every day you hold them. (The bonking game of bigger gophers for the near-sighted so that Wonderland remains handicap accessible.)
  • In Switzerland, people are cuing up in the ticket line to give the government their money to hold for a fifty year ride now that the Swiss 50-year bond has turned negative. (Wonderland’s biggest gopher for the totally blind. You don’t just hit this one; it takes you the ride of your life for the rest of your life. We call it “Gopher Broke.”)
  • US jobs crashed in May, causing stocks to drop, but rebounded in June, causing stocks to rise, so that May is now seen as an unexplained anomaly. (Welcome to Ripley’s House of Unexplained Economic Mysteries.)
  • The Great Britain Pound crashed to a thirty-year low against the dollar. (Enjoy your ride on the currency bumper cars!)
  • Japan’s decade of quantitative wheezing has accomplished so little that they’re going to cough up more of the same all over again because it was so much fun the first five times. (House of Bodily Humors and Horrors.)
  • Central banks in Europe say they need to and will crank their own quantitative easing back up, so effective have all previous rounds been. (And, so, the merry-go-round spins and the calliope plays its happy music in Euro Dizzyland.)
  • Falling oil prices, which contributed significantly to January’s spectacular stock market plunge, are going back down the pipeline while oversupply is building rapidly at the bottom again with the buildup reaching its highest point in ten weeks. (Wonderland’s log ride through oil with more than one crude splash.)
  • Venezuela and Brazil are collapsing into economic chaos. (It’s more fun than that bungy-jumping vehicle for two at the carnival.)
  • Etc. (I know, darn! Just as he was on a roll. Well, hang on…)


Yet, the S&P 500 and Dow have soared to all-time record highs! Whoohoo! Hold onto your safety harness and try not to choke on your popcorn for the fun never ends in Bankster Wonderland!


What’s up with stocks and down with bond yields?


US Stocks are flying high at the same time demand for sovereign bonds is soaring and precious metals are experiencing a bull market. That says to me that money is fleeing to safety, and the apparent irrational exuberance in the stock market, considering all the flights to safety, is partially fueled by foreign investors fleeing to US investments now that Europe’s cracks are showing like Frankensteins body seams.

This chart from David Stockman’s Contra Corner shows how people are piling into bonds right now:


BondFlows


As a result, US bond interest rates are the lowest they have been in the history of this nation! Here’s another chart from Contra Corner:


US Bond Interest Rates


Whoohoo! Two massive records in one week. Highest stock market prices and lowest bond rates in the history of the United States! Does it get any better than this? Geez, I love this place!


We have never seen anything like this


Stocks are setting all-time record highs, and interest on US bonds is hitting all-time record lows. Money is running to gold and silver. Money is running to long-term sovereign bonds. And money is running to the US stock market all at the same time. Heck, money is running all over the place! What is there not to be happy about?

However, before you think, Whoo! the stock market is going up; there’s no crash happening, ask yourself what the heck is happening. We’ve never before seen either of these two extremes where stocks are free of all bondage and all bonds are free of their stocks. Only during the years of quantitative easing and zero-interest-rate policy have we seen bonds and stocks play together, but never to this extreme. So, when all the gauges on the instrument panel are pegging their needles past the red zone, including the one that says “We’re going super fast now,” you might want to say, “Whoa! What’s going on?” Maybe the engineer on this train has fallen dead over the throttle.

As Jesse Felder said on Contra Corner, “We’re witnessing the greatest dichotomy in the history of financial markets.” Interest rates on bonds have now gone below any low of any recession … ever. Far, far below. We’re digging out the sub basement to find where the money is buried. If you were to gauge the economy’s future based on where bonds have gone, you’d have to say, “This must be the scariest future ever because there has never been such a flight to presumably safe vehicles at any cost.”

At the same time, stocks have never been more overpriced than they are today. They hit their highest price ever during a period in which earnings have been flagging for many months. So, they’re not rising because, “Woohoo! Businesses are making bank!” No, they’re making new heights in spite of the fact that sales are down, profits are down, and wholesale inventories have remained locked in a highly backed-up position that is comparable only to the Great Recession and the dot-com crash … and while things are not looking generally good in the world economically. So, there is not a lot of reason to think sales will grow to fit the high stock values. In other words, median price-to-sales ratio (price of stocks compared to sales of the businesses) has also hit an all-time record high.

Three all-time records in one week! This is the funnest place in the universe!

Is this irrational euphoria among investors? Is it even people who are buying the bonds? Is it people who are buying the stocks? Or is it entities like central banks and their proxies — not buying them as investments, but buying them in mass to shore up the entire global economy and stop the crash that started right after Brexit … or that started right after December 16, 2015? (It’s just one crash right after another here at Wonderland’s National Demolition Derby.) Are central banks firing up all engines to stop a crash in its tracks with a massive coordinated salvo of purchases?


So, what is happening as central bankers watch each other in mutual admiration?


central banker mutual admirationCentral banker mutual admiration

Says Jeff Cox of CNBC,

The reason anyone would buy negative-yielding debt is actually pretty simple: Because they have to. They are central bankers looking to help promote economic growth. They are insurance companies, pension funds and money managers who have to match liabilities with assets. They are not, by and large, retail investors who are so afraid of risk that they’re willing to pay for the privilege of lending money to a government. Together, those buyers have helped build a nearly $12 trillion funnel of negative-yielding sovereign debt — unprecedented in world history.


Gee, there are a lot of things breaking historic world records this week. That must mean it’s a great week!

Cox thinks the big buyers of bonds are central banks, pushing down interest rates to stimulate the economy. No surprise there. Central banks have been going pedal-to-the-metal to hold interest rates to the floor for almost a decade, so why not continue? The record highs in bond sales (with corresponding lows in interest) and high in stock sales most likely are due to rapid pressure being applied to the accelerator as a counter-measure to the concerns governments and bankers have had about Brexit.

Central banks could do that directly, or they could do it invisibly (since they operate under a cloak most of the time anyway) by offering enticements or pressure to their proxies. (“You want this mega-conglomerating merger to happen: buy ten billion dollars worth of US bonds, and then I’m sure we can get it approved.” If not that, there’s a thousand other ways for central banks to push money into markets now that they are accustomed to doing so in an unbridled fashion. It’s the new norm.)

That the stock markets are being driven up by central bank purchases can be seen in the following graph:


Huge rise in central bank stock purchases


Emerging markets (EM) that were crashing at the start of 2016 offloaded assets to raise funds to keep the home front running at the start of the year. That contributed to January becoming the worst January in the history of the US stock market — worse than any start of a year in the Great Depression or the Great Recession. The central Bank of Japan and the European Central Bank increased their buying of those assets to offset that fall, and both recently announced they are going to apply a lot more stimulus.

Cox goes on to write,


Ostensibly, the global race to the bottom was supposed to stimulate growth, and it may just well keep pushing risk assets [stocks in particular] higher. But what awaits on the other side is adding to the worries of investing professionals. “Ultimately, there will be a day of reckoning,” said Erik Weisman, chief economist at MFS Investment Management…. There remains a pervasive feeling on Wall Street that the risk rally is built on sand, with a price to pay in a world where owning government debt no longer pays but rather costs.


Even central banksters who create money out of nothing cannot create a free lunch.  Somebody pays, but probably you, not them. It’s an ominous feeling really — a sense that there is no underlying reality anymore — that the sands are shifting under your feet.


“There’s no doubt that there are and will continue to be unintended consequences, and the further we move away from something conventional into unconventional, the ratio of unintended consequences to intended consequences will rise,” Weisman said.


We’re seven years on since stimulus responses to the Great Recession began. These have also been the greatest stimulus measures in the history of the world. (No wonder these rides are so thrilling as they reach new world records multiple times a week.) However, outside of flying stocks, we still have a global economy that seems endlessly stuck in the dog days of summer. Or, to change to my old winter metaphor (now that summer has turned abnormally cold here where I write), the longer and harder the snow plows push the snow straight ahead, the more it piles up as an impossible obstacle ahead of them. The louder they get with chained tires clawing and engines roaring and smoking, the less snow they push. The plows are now grinding away at full throttle in the lowest gear they have, and it is looking like they are going to remain stuck in that gear for a very long time — maybe another decade … unless they simply give up the battle.

The world is buried under the highest mountains of the cheapest debt ever imaginable, and nothing is moving in the overall economy (except financial instruments that are trading places). And that is where I said we would wind up when I wrote my very first articles in my Downtime series on government bailouts and stimulus back at the start of the Great Recession. I said they were pushing all the snow straight ahead, instead of off to the side, so (quite a ways down the road) they would have a mountain of snow so high in front of them that all the plows in the world could push it no further. We are now quite a ways down the road.

The European banks that are screaming for bailouts are buried in bad debt they pushed forward from the Great Recession. They never wrote it off then because the damage to their balance sheets would have been so severe. As I said back then, such policies only meant the damage to their balance sheets in the future would be even more severe. The problem of bad debt owned by banks in Italy is now four times worse than it was at the bottom of the Great Recession.

Why did I know that would happen? Because nothing about this “recovery” is recovery. It has all been a forestalling of problems, “kicking the can further down the road,” with the inevitable pay-back time becoming worse the longer we forestall the inevitable write-off of bad debt. My Downtime articles years ago sounded many warnings that everything governments and central banks were doing was making a very bad situation worse just so we could avoid the pain at the time. Such actions resolved none of the true underlying problems that are built right into the foundation of our debt-based economy. Until we stop thinking we can build true monuments of wealth over ever-growing chasms of debt, we will solve nothing at all.

Europe’s banking troubles are now far deeper than they were at the belly of the Great Recession Part One. Europe endlessly scrambles to solve banking troubles that become harder to solve with each new phase. The snow plows I talked about in my Downtimeseries have not only stopped pushing the snow ahead, but the drift is now avalanching back onto them and pushing the plows backward, even as their wheels are spinning and screeching forward.

(This is what we do in the parking lots here in Winter Wonderland.)


Why else would the entire financial world be upside down?


Another explanation for the greatest dichotomy in financial history that is now happening in the US is that money is exiting European markets and fleeing to anything in the US because the US remains the best looking corpse in the cemetery; so, if you want to dance with stocks, do so with Stockzilla, bride of Bankenstein. What appears completely irrational is in part a flight of money from one part of the world to the last safe place on earth. (Safe for the moment, but moments count when you’re fleeing an avalanche.)

Central banks have become the biggest bullies in the playpen. With the biggest bullies pushing their weight around as much as they possibly can, there is no safe place for small investors in the playpen. So, individual investors around the world are fleeing to the safest investments they can think of. With Europe in such volatile flux and China being such an unknown with its own massive upheavals, what more readily comes to mind right now as a final resting place than the good ol’ US of A?

Naturally, the US will be the last major economy affected by the second avalanche of bank failures, which this time has started in Europe. Brexit isn’t likely to trigger anything in the US directly, other than the immediate panic selling that was seen in stocks right after the vote. Once it was clear that Brexit wasn’t going to destroy the United States, some euphoria within the US probably kicked in and helped push the stock market up rapidly past its long-standing ceiling because that euphoria was accompanied by even larger money flows from outside the nation as people ran for cover.

Brexit appears to be triggering the failure of banks that were too fat to fail, lest they flounder upon us and squish us all — some of the world’s most established banks. As things fall apart to this unprecedented degree in Europe, money has to run somewhere, and the US casino still has pretty lights that can be seen as far away as the growing darkness in Europe.

The United States will not remain immune to what is happening in Europe forever, but the hot air coming out of Europe’s balloon may fill the US sails for awhile. For the moment, the US is the beneficiary of Europe’s decline.

This could be a brief moment, however, as there are likely to be surprising connections (black-swan events) between Europe’s failing banks and US banks that materialize faster than anyone expects. We’re sailing in uncharted territory that looks nothing like anything we’ve seen before, so who knows what comes next in a world where stocks soar in the face of generally gloomy economic news while bond sales also soar at the lowest interest rates in history? (Welcome to our Pirates of the Caribbean boat ride where Mario Draghi plays the part of Jack Sparrow!)

With Europe reaping the whirlwind as its banks turn out the lights, with China looking lost and confused and sometimes spinning erratically, with Japan ecstatically voting to start its umpteenth round of unsuccessful quantitative easing, with South America breaking into greater anarchy every day of its pitiful, starving life, and with the US in longterm manufacturing decline with corporate profit growth also in continual decline, one cannot seriously think the world is just going to pull out of this!

That means those who are buying stocks because they believe there’s a new 30% rising bull market just beginning are taking euphoria to new heights, too. They are, in the very least, taking a perilous ride.


“Investors are buying bonds for capital appreciation and stocks for income. The world has turned upside down,” said James Abate, chief investment officer at Centre Asset Management LLC. The shift, according to Abate, has been fueled by central-bank stimulus inflating government-bond prices across the world, pushing yields on nearly $12 trillion of government debt into negative territory. And as bond yields tumble, more and more equities are yielding more than government bonds, spurring demand for companies offering sustainable income in the form of dividend payments. “It is a poison brew that central banks keep serving us,” Abate said. (MarketWatch)


In other words, central banks have taken all rationality out of all financial markets … at least in one sense. Everything everywhere now is contingent upon what central banks are doing. The contagion of their poison is ubiquitous. There is another sense, however, in which this is all rational. I call it the new rationality: central banks have all the money, and money follows money. So, individual investors are doing the best they can in following the money. So, in terms of global economics and politics, its irrational; but in terms of following the makers of money who run the show, it makes perfect sense. It has is own mad mindset.


“There’s a perception there’s a greater fool behind you,” Kohli said, pointing to the strategy of buying a bond with the intention to sell later at a higher price. But the main forces behind the rally, Kohli added, are central-bank purchases that keep fueling demand and propelling prices higher.… What’s more, the recent divergence between the main U.S. equity indexes and benchmark Treasury yields has been flashing “mind the gap” signals that fuel fears of a sharp correction…. So, despite popular belief, the decline in interest rates “should be viewed as a bad sign,” noted BAML’s Global Rates and Currencies Research team, in a report released Monday. “Too often we have heard how declining interest rates are good news and are used as a justification for investors being pushed out the risk spectrum. We disagree and argue this time is different and the decline in rates should be interpreted as a bad sign,” the analysts noted. (MarketWatch)


If Kohli’s first statement doesn’t sound like the definition of a Ponzi scheme, what does?

Celebrate because the Epocalypse is here!In terms of everything that once made sense financially, central banks’ transformation of this world into Wonderland is now complete. In this topsy-turvy world, Mad Hatters may not be so mad as they look. Everyone is simply trying to maneuver around the biggest bullies in the playpen by finding the safest place to play. It’s the new rationality of a world intentionally turned on its head — at last, by nearly everyone’s recognition — even more than it is euphoria. The irrationality has become obvious. What is not so obvious is the rationality of the irrationality.

In other words, if investors take the bullish gamble on a rising stock market in the US at a time when most of the world is falling apart, they may be right for all the wrong reasons … for now. In Central Bank Wonderland, they have nowhere to fall but up. On a short-term basis (probably very short-term) market bulls could be right only because all the other circling drain holes around the world are dumping into sovereign bonds, precious metals … and the US stocks as the last casino open for business. Everything is now flowing into the extreme zone at the same time.

You can bet on the wild ride in US stocks, or you can bet on bonds that guarantee you almost nothing (or even less than nothing), or you can bet on precious metals. All three markets are rising together right now. The question is which one is likely to continue rising as Europe disintegrates, the oldest banks in the world crash, China teeters between crashes and stimulus while running the world’s most notoriously cooked books, Japan takes the governor off the throttle and flies with full-hot afterburners blazing into the rarified nozone, and South American economies implode into social chaos?

This is the crazy new zombie economy I call “The Epocalypse” — a world of economic collapse everywhere, apocalyptic in scale, epic in that it already exceeds the greatest extremes in history, and epoch in that it will come to be known as its own period in time. One word that says it all.

You have witnessed the beginning of this hideously convoluted world, and it only gets more distorted from here because nothing has been done to right the essential problems that are creating this grotesque chaos while ungoverned greed rules the day.

The children are no longer asking, “Are we almost there yet?” We’ve arrived, and they’re now asking if they can go home. Welcome to Central Bank Wonderland where Janet Yellen is the Queen of Hearts and all the little carnival riders are Mad Hatters whose moves are rational if you live in a world with irrational rules created by truly mad leaders. Dinner is served in our Zombie Epocalypse Room where only zombie banksters get to dine … and dinner is you! You see, if you were ever able to walk out the back door of Wonderland and look over your shoulder, the sign above the door says “Hotel California.” You are always welcome here … and can never leave.

Doest it get any more fun than this?

Sure it does. Wait till you see Act Two, which could be as early as next week!
Stocks Rally - Is Brexit Systemic Risks Contained?

Published here: http://redirect.viglink.com?u=http%3A%2F%2Fwww.zerohedge.com%2Fnews%2F2016-07-13%2Fstocks-rally-brexit-systemic-risks-contained&key=ddaed8f51db7bb1330a6f6de768a69b8

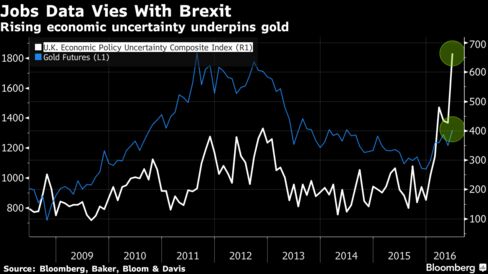
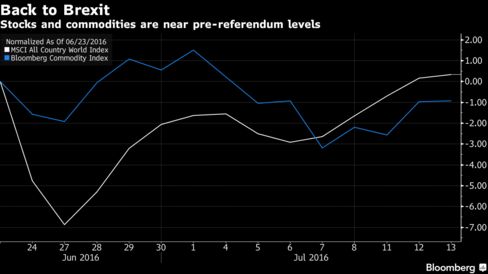
Equity markets globally have rebounded to their pre-Brexit levels and volatility in financial markets is the lowest that it has been for a month. Even the precious metals rally has taken a breather. Are the markets suggesting that the fallout from Brexit is less than previously thought and that the systemic risk posed by the UK leaving the EU is contained.

The emergence of Theresa May as the new Prime Minister of Great Britain has at least given a degree of certainty in what was looking like a political vacuum but is this enough to ease the nerves of the financial markets. In the short term, at least it would appear so.

Unexpectedly, calm is returning to global markets on speculation central bank action will be sufficient to restrict any Brexit contagion. Economists predict the Bank of England will cut interest rates Thursday, while Japanese Prime Minister Shinzo Abe has ordered more fiscal stimulus. Traders are pricing in less than 35 percent odds of the Federal Reserve raising rates this year.

Today, Bloomberg takes a look at what one Fund Manager has described; "“the strangest environment I’ve seen in 30 years”

The full report can be read here 

7RealRisksBanner


Gold and Silver Bullion - News and Prices

Gold hovers near previous session's lows on stronger equities (Reuters)

Gold plunges in broad risk-on trade, as Dow hits all-time high (Investing.com)

Silver surrenders gains to join gold’s retreat (MarketWatch)

IMF sees 'negligible' Brexit impact on U.S. growth (Reuters)

US wholesale inventories rise slightly, sales extend gains (CNBC)

That’s it: I’m calling the low on the pound (MoneyWeek)

Gold Prices (LBMA AM)

13 July: USD 1,340.25, EUR 1,211.45 & GBP 1,009.74 per ounce
12 July: USD 1,352.85, EUR 1,217.84 & GBP 1,029.11 per ounce
11 July: USD 1,358.25, EUR 1,231.66 & GBP 1,059.95 per ounce
08 July: USD 1,356.10, EUR 1,224.83 & GBP 1,047.45 per ounce
07 July: USD 1,367.10, EUR 1,233.40 & GBP 1,052.80 per ounce
06 July: USD 1,370.00, EUR 1,239.71 & GBP 1,059.01 per ounce
05 July: USD 1,344.75, EUR 1,207.05 & GBP 1,023.89 per ounce

Silver Prices (LBMA)

13 July: USD 20.29, EUR 18.31 & GBP 15.25 per ounce
12 July: USD 20.35, EUR 18.35 & GBP 15.47 per ounce
11 July: USD 20.47, EUR 18.53 & GBP 15.78 per ounce
08 July: USD 19.72, EUR 17.82 & GBP 15.20 per ounce
07 July: USD 19.95, EUR 18.00 & GBP 15.31 per ounce
06 July: USD 20.43, EUR 18.46 & GBP 15.75 per ounce
05 July: USD 19.73, EUR 17.69 & GBP 14.99 per ounce


Recent Market Updates

- Britain has a new prime minister – here’s what that means for you
- Metals Caught Between Global Gloom, U.S. Job Gains as Gold Slips
- Central Bank Resumes Monthly Gold Buying in Bid to Diversify Reserves
- Property Fund Turmoil in the UK has Eerie Echoes of Bear Stearns
- "In Gold We Trust" Annual Report - New Bull Market "Emerging"
- 3 Charts Show "How Precious Brexit Is" for Gold and Silver Bullion
- Gold, Silver Best Performing Assets In H1, 2016 – Up 26% & 38%
- Gold Surges to $1,313/oz – Fed Concerned Re Outlook, BREXIT and May “Consider Using Helicopter Money”
- Gold Prices Higher For 5th Session On BREXIT and FED
- Soros Buying Gold On BREXIT, EU “Collapse” Risk
- UK Gold Demand Rises On BREXIT “Nerves”

Applied Materials, Inc.: Triple Threat Could Send AMAT Stock Soaring

Published here: http://redirect.viglink.com?u=http%3A%2F%2Fwww.profitconfidential.com%2Fstock%2Fapplied-materials-inc-triple-threat-could-send-amat-stock-soaring%2F&key=ddaed8f51db7bb1330a6f6de768a69b8

AMAT Stock Is Back
Applied Materials, Inc. (NASDAQ:AMAT) is the world leader in the production of semiconductor and display equipment. Applied Materials is the 800-pound gorilla in this industry. Given its size and stature, AMAT stock has not been able to match its 2000 tech bubble high and currently sits 46% below it.

There is a silver lining to this story, though. Strong product demand and growth in China has reinvigorated investor demand. AMAT stock is up 12.8% after the Brexit sell-off and up 36% year-to-date, outperforming its peers in the process.

The.

The post Applied Materials, Inc.: Triple Threat Could Send AMAT Stock Soaring appeared first on Profit Confidential.

Gold – the Oldest Payment Option

Published here: http://redirect.viglink.com?u=http%3A%2F%2Fgoldsilverworlds.com%2Fgold-silver-stocks-news%2Fgold-the-oldest-payment-option%2F&key=ddaed8f51db7bb1330a6f6de768a69b8

Gold

Gold – the oldest payment option for a lot of players, is still something that a lot of players are ultimately going to think about and want to use. People are still going to need to play online casino games electronically, of course. However, when people play table games such as Black Jack at the Royal Vegas Online Casino, it is going to feel as if most of the cash transactions and most of everything that goes on there manages to be indirect. Gold – the oldest payment option may not be exactly what people use today, but in many ways, the currency has really not changed all that much over the years.

The Royal Vegas Online Casino is an online casino that is well known for the fact that among other things, the payment aspect of everything is positive. People can enjoy a lot of different payment options through the Royal Vegas Online Casino. They will also find that they are able to get everything quickly enough, since the website has a short payout period. Gold – the oldest payment option, but people would never be able to get results like that if they were using many of the more old-fashioned payment methods. When people play table games such as Black Jack, they are going to use forms of currency that are more modern today but that are just as effective in today’s society.

Some people have a tendency to believe that gold is a more effective currency just because it is older than most of what people purchase today. Ever since the late 2000’s, there has also been a resurgence in buying gold, as a lot of people are under the impression that this is one of the only forms of currency that is not going to betray them in terms of its shrinking value over the years. Gold – the oldest payment option, and it is the most secure banking option according to a lot of people. They might feel that electronic money is not real money. These people are probably the very same people who tend to devalue online activities of all kinds, even if these are the sorts of online activities that mirror what people do in real life anyway.

Gold – the oldest payment option, but that does not mean that gold is not going to go up and down in terms of value. All forms of currency do that at some point or another. Everyone is going to have to live with uncertainty on this level. The electronic money that people use is highly guarded and protected today, and it is just as real as all of the other forms of currency that people might use today. When people play table games such as Black Jack at the Royal Vegas Online Casino with their electronic currency, everything that they are doing is very real, and just as real as it would be if they were in the city of Las Vegas and betting on every game using gold bars.

Tuesday, July 12, 2016

Britain has a new prime minister – here’s what that means for you

Published here: http://redirect.viglink.com?u=http%3A%2F%2Fwww.zerohedge.com%2Fnews%2F2016-07-12%2Fbritain-has-new-prime-minister-%25E2%2580%2593-here%25E2%2580%2599s-what-means-you&key=ddaed8f51db7bb1330a6f6de768a69b8

Theresa May is set to become the Prime Minister of Great Britain in the next few days. Will the new PM bring a degree of stability back to turbulent markets in a post-Brexit Britain or what does the future hold under a new Conservative leadership.

Theresa May © Getty Images

MoneyWeek's John Stepak takes a look at the implications for investors and identifies why financial markets are relieved and considers what might be next for the British Pound.

That was surprisingly quick and painless.

Britain is about to have a new prime minister: Andrea Leadsom pulled out of the race yesterday, and Theresa May is going to be the new boss.

 
The full report can be read here 
 

7RealRisksBanner


Gold and Silver Bullion - News and Prices

PRECIOUS-Gold steady after falling in the previous session (Reuters)

Gold miners expand hedge book by another 50 tonnes in first quarter: report (Reuters)

Citigroup Backs Commodities for ‘17 in ‘Especially Bullish’ Call (Bloomberg)

S&P 500 poised for fresh record as Alcoa spurs earnings optimism (Marketwatch)

Citigroup Is ‘S&P 500 Climbs to Record High as Dollar Rallies; Treasuries Drop (Bloomberg)

Gold Prices (LBMA AM)

12 July: USD 1,352.85, EUR 1,217.84 & GBP 1,029.11 per ounce
11 July: USD 1,358.25, EUR 1,231.66 & GBP 1,059.95 per ounce
08 July: USD 1,356.10, EUR 1,224.83 & GBP 1,047.45 per ounce
07 July: USD 1,367.10, EUR 1,233.40 & GBP 1,052.80 per ounce
06 July: USD 1,370.00, EUR 1,239.71 & GBP 1,059.01 per ounce
05 July: USD 1,344.75, EUR 1,207.05 & GBP 1,023.89 per ounce
04 July: USD 1,348.75, EUR 1,213.07 & GBP 1,016.42 per ounce

Silver Prices (LBMA)

12 July: USD 20.35, EUR 18.35 & GBP 15.47 per ounce
11 July: USD 20.47, EUR 18.53 & GBP 15.78 per ounce
08 July: USD 19.72, EUR 17.82 & GBP 15.20 per ounce
07 July: USD 19.95, EUR 18.00 & GBP 15.31 per ounce
06 July: USD 20.43, EUR 18.46 & GBP 15.75 per ounce
05 July: USD 19.73, EUR 17.69 & GBP 14.99 per ounce
04 July: USD 20.36, EUR 18.31 & GBP 15.36 per ounce


Recent Market Updates

- Metals Caught Between Global Gloom, U.S. Job Gains as Gold Slips
- Central Bank Resumes Monthly Gold Buying in Bid to Diversify Reserves
- Property Fund Turmoil in the UK has Eerie Echoes of Bear Stearns
- "In Gold We Trust" Annual Report - New Bull Market "Emerging"
- 3 Charts Show "How Precious Brexit Is" for Gold and Silver Bullion
- Gold, Silver Best Performing Assets In H1, 2016 – Up 26% & 38%
- Gold Surges to $1,313/oz – Fed Concerned Re Outlook, BREXIT and May “Consider Using Helicopter Money”
- Gold Prices Higher For 5th Session On BREXIT and FED

- Soros Buying Gold On BREXIT, EU “Collapse” Risk
- UK Gold Demand Rises On BREXIT “Nerves”
- Pensions Timebomb in “Slow Motion Detonation” In UK, EU, U.S.

Monday, July 11, 2016

Metals Caught Between Global Gloom and U.S. Job Gains

Published here: http://redirect.viglink.com?u=http%3A%2F%2Fwww.zerohedge.com%2Fnews%2F2016-07-11%2Fmetals-caught-between-global-gloom-and-us-job-gains&key=ddaed8f51db7bb1330a6f6de768a69b8

Better than expected employment figures in the US causes gold to take a breather after gaining more than 28% since the beginning of the year.

Bloomberg takes a look at the current competing bullish and bearish forces affecting the outlook for precious metals.

Metal markets are caught between global gloom and renewed U.S. optimism.

A six-week surge by gold, the quintessential haven investment, stalled on Friday as better-than-expected U.S. jobs data blunted global economic concern that has boosted safe-haven demand. Copper, often used as a barometer for the global economy, gained as much as 0.9 percent after the labor report.

Gold has climbed 28 percent this year, with demand for havens surging after the U.K.’s Brexit vote and traders cutting bets on the Federal Reserve increasing interest rates this year. The Fed wants more proof that hiring has resumed a healthy pace and that economic momentum is intact before raising interest rates, minutes released Wednesday of last month’s meeting showed.

The full report can be read here 
 

7RealRisksBanner


Gold and Silver Bullion - News and Prices

Gold steady on Brexit concerns despite firmer equities (Reuters)

Gold ends lower but books 6th straight weekly advance (Marketwatch)

U.S. economy posts largest job gains in eight months in June (Reuters)

PRECIOUS-Gold slides on U.S. payrolls before recovering (Reuters)

Citigroup Is ‘Bullish Commodities’ for ‘17 as Brexit to Fade (Bloomberg)

Gold Prices (LBMA AM)

11 July: USD 1,358.25, EUR 1,231.66 & GBP 1,059.95 per ounce
08 July: USD 1,356.10, EUR 1,224.83 & GBP 1,047.45 per ounce
07 July: USD 1,367.10, EUR 1,233.40 & GBP 1,052.80 per ounce
06 July: USD 1,370.00, EUR 1,239.71 & GBP 1,059.01 per ounce
05 July: USD 1,344.75, EUR 1,207.05 & GBP 1,023.89 per ounce
04 July: USD 1,348.75, EUR 1,213.07 & GBP 1,016.42 per ounce
01 July: USD 1,331.75, EUR 1,199.51 & GBP 1,001.34 per ounce

Silver Prices (LBMA)

11 July: USD 20.47, EUR 18.53 & GBP 15.78 per ounce
08 July: USD 19.72, EUR 17.82 & GBP 15.20 per ounce
07 July: USD 19.95, EUR 18.00 & GBP 15.31 per ounce
06 July: USD 20.43, EUR 18.46 & GBP 15.75 per ounce
05 July: USD 19.73, EUR 17.69 & GBP 14.99 per ounce
04 July: USD 20.36, EUR 18.31 & GBP 15.36 per ounce
01 July: USD 19.24, EUR 17.29 & GBP 14.48 per ounce


Recent Market Updates

- Central Bank Resumes Monthly Gold Buying in Bid to Diversify Reserves
- Property Fund Turmoil in the UK has Eerie Echoes of Bear Stearns
- "In Gold We Trust" Annual Report - New Bull Market "Emerging"
- 3 Charts Show "How Precious Brexit Is" for Gold and Silver Bullion
- Gold, Silver Best Performing Assets In H1, 2016 – Up 26% & 38%
- Gold Surges to $1,313/oz – Fed Concerned Re Outlook, BREXIT and May “Consider Using Helicopter Money”
- Gold Prices Higher For 5th Session On BREXIT and FED

- Soros Buying Gold On BREXIT, EU “Collapse” Risk
- UK Gold Demand Rises On BREXIT “Nerves”
- Pensions Timebomb in “Slow Motion Detonation” In UK, EU, U.S.
- Silver – Perfect Storm Brewing in the Market

SPDR Gold Trust gold bars at the Bank of England

Published here: http://redirect.viglink.com?u=http%3A%2F%2Fwww.zerohedge.com%2Fnews%2F2016-07-11%2Fspdr-gold-trust-gold-bars-bank-england&key=ddaed8f51db7bb1330a6f6de768a69b8

By Ronan Manly, BullionStar

One of the most notable developments accompanying the gold price rally of 2016 has been the very large additions to the gold bar holdings of the major physically backed gold Exchange Traded Funds (ETFs). This is especially true of the SPDR Gold Trust (ticker GLD).

The gold bar holdings of the SPDR Gold Trust peaked at 1353 tonnes on 7 December 2012 before experiencing a precipitous fall in 2013, and additional and continued shrinkage throughout 2014 and 2015. On 17 December 2015, the gold holdings of the SPDR Gold Trust hit a multi-year low of 630 tonnes, a holdings level that had not been seen since September 2008.

SPDR Gold Trust - 5 year chart of gold holdings and gold price. Black line - gold holdings in tonnes. Source: http://www.goldchartsrus.com

By 31 December 2015, GLD 'only' held 642 tonnes of gold bars. See above chart. Then as the New Year kicked off in January 2016, something dramatic happened. The SPDR Gold Trust began expanding its gold holdings again, and noticeably so. By 31 March 2016, the Trust held 819 tonnes of gold bars, and by 30 June 2016, it held 950 tonnes of gold bars. The latest figure at time of writing is 981 tonnes of gold bars as of 8 July 2016. (Source: GLD Gold holdings spreadsheet). 

This is a year-to-date net change of 338.89 extra tonnes of gold bars being held within the SPDR Gold Trust. See chart below. That's a 52.8% increase compared to the quantity of gold bars the Trust held at the end of 2015, and a phenomenal amount of gold by any means, since it's over 10% of annual new mine supply, and also a larger quantity of gold than all but the world's largest central banks hold in their official gold reserves. Where is all of this gold being sourced from? That is the billion dollar question. Some is obviously being imported from Swiss refineries, but perhaps not all of it.

SPDR Gold Trust - 6 month chart of gold holdings and gold price. Black line - gold holdings in tonnes. Source: http://www.goldchartsrus.com
 

In January 2016, 26.8 tonnes of gold bars were added to the SPDR Gold Trust, while a massive 108 tonnes of gold bars were added in February 2016. The first quarter was rounded off with an additional 42 tonnes of gold bars added in March, bringing the Q1 additions held by GLD's gold custodian HSBC London to 176.91 tonnes of gold bars. Noticeably, some large 1-day increases in GLD's gold bar holdings occurred on 1 February (over 12 tonnes), 11 February (over 14 tonnes), 19 and 22 February (over 19 tonnes each day), and 29th February (nearly 15 tonnes), and also on 17 and 18 March (11.9 tonnes of gold bars added each day).

The second quarter saw a 15 tonne shrinkage of GLD's gold holdings in April, but a very large 64.5 tonne increase in May, and a 81.4 tonne increase in June, making for a Q2 increase in GLD's gold bar holdings of 130.77 tonnes. Very large 1-day gold bar additions occurred on 24 and 27 June (18.4 tonnes and 13 tonnes respectively). Overall, that's 307 tonnes added to GLD in the first half of 2016.

Adding the 31.2 tonne addition for July to date gives the 338.89 tonnes addition figure quoted above. Most of this was due to a large 1-day inflow of 28.81 tonnes of gold bars reported on 5 July.

SEC - Reveal the subcustodians

I have detailed the above GLD gold bar holding changes to provide some background and put more color on the important discussion which follows.

While looking through SEC filings of the SPDR Gold Trust last month, I came across some interesting correspondence between the SEC and the sponsor of the SPDR Gold Trust, World Gold Trust Services. World Gold Trust Services is a fully owned subsidiary of the World Gold Council (WGC).

On 29 March 2016, the US Securities and Exchange Commission (SEC) sent a letter to the SPDR Gold Trust (c/o World Gold Trust Services, LLC) essentially telling the SPDR Gold Trust to in future specify in its SEC filings the identities of the sub-custodians that are storing any of the Trust’s gold bar holdings during each reporting period. The SEC’s letter stated:

“We understand that the Custodian may appoint one or more subcustodians to hold the Trust’s gold and that the Custodian currently uses a number of subcustodians, identified on page 18. You also outline risks that may arise in connection with the use of subcustodians. In future Exchange Act periodic reports, to the extent material, please disclose the amount of the Trust’s assets that are held by subcustodians.”

The page 18 referred to by the SEC is page 18 of the annual 10-K filing of the SPDR Gold Trust for the year ended 30 September 2015, which includes the following paragraph:

“The Custodian is authorized to appoint from time to time one or more subcustodians to hold the Trust’s gold until it can be transported to the Custodian’s vault. The subcustodians that the Custodian currently uses are the Bank of England, The Bank of Nova Scotia-ScotiaMocatta, Barclays Bank PLC, JPMorgan Chase Bank and UBS AG.

In accordance with LBMA practices and customs, the Custodian does not have written custody agreements with the subcustodians it selects. The Custodian’s selected subcustodians may appoint further subcustodians. These further subcustodians are not expected to have written custody agreements with the Custodian’s subcustodians that selected them. The lack of such written contracts could affect the recourse of the Trust and the Custodian against any subcustodian in the event a subcustodian does not use due care in the safekeeping of the Trust’s gold. See “Risk Factors—The ability of the Trustee and the Custodian to take legal action against subcustodians may be limited.”

LBMA above refers to London Bullion Market Association. Note that the SPDR Gold Trust prospectus defines subcustodian as:

“SUB-CUSTODIAN means a sub-custodian, agent or depository (including an entity within our corporate group) selected by us to perform any of our duties under this agreement including the custody and safekeeping of Bullion.”

The SEC letter was addressed to William Rhind who was CEO of World Gold Trust Services, but who actually had resigned as CEO on 9 February 2016, something the SEC should have known since the resignation statement was also filed with the SEC. After receiving the SEC’s correspondence, Samantha McDonald, CFO of World Gold Trust Services, responded by letter to the SEC the next day, 30 March 2016, confirming that:

“We will, to the extent material, disclose in future periodic reports the amount of the Trust’s assets that are held by subcustodians. Please be advised that during fiscal 2015, no gold was held by subcustodians on behalf of Trust.

Note that filings with the US SEC use the naming convention 10-K for an annual filing, and 10-Q for a quarterly filing.

Following the stipulation from the SEC to World Gold Trust Services telling it to reveal its subcustodian holdings, its intriguing to note that when SPDR Gold Trust filed its next 10-Q on 29 April 2016 for the quarter ended 31 March 2016, page 15 of this filing revealed that the Bank of England, as subcustodian, had, during Q1 2016, held up to 29 tonnes of gold on behalf of the SPDR Gold Trust. The relevant section of page 15 stated the following:

“As at March 31, 2016, the Custodian held 26,484,117 ounces of gold on behalf of the Trust in its vault, 100% of which is allocated gold in the form of London Good Delivery gold bars including gold payable, with a market value of $32,760,852,177 (cost — $32,291,685,964) based on the LBMA Gold Price PM on March 31, 2016. Subcustodians held no gold on behalf of the Trust as of March 31, 2016.

During the quarter ended March 31, 2016, the greatest amount of gold held by subcustodians was approximately 29 tonnes or approximately 3.8% of the Trust’s gold at such date. The Bank of England held that gold as subcustodian.

As at September 30, 2015, the Custodian held 21,995,797 ounces of gold in its vault 100% of which is allocated gold in the form of London Good Delivery gold bars including gold payable, with a market value of $24,503,317,923 (cost — $27,103,546,125). Subcustodians held nil ounces of gold in their vaults on behalf of the Trust.”

Some Facts

From the above revelations, some facts can be stated:

  • The Bank of England held a maximum of 29 tonnes of gold on behalf of the SPDR Gold Trust on some date during Q1 2016.

Note that the wording of the 10-Q is such that it does not preclude the possibility that the Bank of England also held GLD gold at other times during Q1 2016, since it states “the greatest amount of gold” that the Bank of England held for the Trust was 29 tonnes. This implies that the Bank of England vaults could, at other times during Q1, have held less than 29 tonnes of gold on behalf of GLD.

  • As per the initial WGTS response to the SEC dated 30 March 2016, no gold was held by HSBC’s subcustodians on behalf of GLD throughout fiscal 2015 (1st October 2014 – 30 September 2015). Furthermore, GLD’s 10-Q to 31 December 2015 states that

To this can be added that according to the SPDR Gold Trust’s 10-Q for Q4 2015, “as at December 31, 2015…Subcustodians held nil ounces of gold in their vaults on behalf of the Trust”

The GLD 10K (annual) for the year to 30 September 2015, filed on 24 November 2015, also contains a few statements addressing whether gold was held by subcustodians on year-end dates in 2014 and 2013. However, it states that subcustodians did not hold gold on behalf of the SPDR Gold Trust on these two dates. Page 44 states:

"As at September 30, 2014, the Custodian held 24,867,158 ounces of gold in its vault 100% of which is allocated gold in the form of London Good Delivery gold bars including gold payable, with a market value of $30,250,898,159 (cost — $30,728,152,437). Subcustodians did not hold any gold in their vaults on behalf of the Trust.”

As at September 30, 2013, the Custodian held 29,244,351 ounces in its vault 100% of which is allocated gold in the form of London Good Delivery gold bars including gold payable, with a market value of $38,792,631,793 (cost — $35,812,777,235). Subcustodians did not hold any gold in their vaults on behalf of the Trust."

How did Bank of England suddenly become a GLD subcustodian in Q1 2016?

As a member of London Precious Metals Clearing Limited (LPMCL), HSBC maintains gold bullion account facilities at the Bank of England which can be used within its LPMCL gold clearing role. All 6 LPMCL bullion bank members hold gold accounts at the Bank of England. The 6 LPMCL members can also all call on each other for physical delivery of gold and allocation of gold. All of these bullion banks except ICBC Standard are also Authorized Participants (APs) of GLD, i.e. Barclays, HSBC, JP Morgan, Scotia, and UBS. Other AP's of GLD include entities of Credit Suisse, Goldman Sachs, Merrill Lynch and Morgan Stanley. Many of these bullion banks are also LBMA market makers in gold.

My view is that quite a number of other bullion banks that are members of the LBMA also hold gold accounts at the Bank of England, such as BNP Paribas, Natixis, SocGen and Standard Chartered, otherwise they would not be able to engage in the gold borrowing activities that they are on record of engaging in. If this is the case, then gold bars can easily be moved from central bank accounts at the Bank of England to bullion bank gold accounts at the Bank of England and vice-versa  Only APs of GLD are allowed to create baskets of GLD securities. This creation process requires that when GLD baskets created, APs have to deliver physical gold bars to HSBC.

There are therefore a number of  possibilities to explain how the Bank of England ended up being a sub-custodian for GLD in Q1 2016.

  1. An AP(s) had gold bars stored at the Bank of England, and delivered these gold bars to HSBC at the Bank of England in fulfillment of the GLD share creation process
  1. An AP(s) had an unallocated credit balance of gold with a LPMCL clearer or other entity which had gold stored at Bank of England or access to gold at the Bank of England, and as part of the clearing process the AP converted unallocated credit balances into allocated gold bars held at the Bank of England and delivered these gold bars to HSBC.
  1. An AP(s) borrowed gold from a central bank which had gold bars stored at the Bank of England and delivered these gold bars to HSBC as part of the GLD basket creation process.

The quantity of 29 tonnes is a lot of gold for an Authorized Participant or group of APs to have un-utilised in a vault at the Bank of England. It's about 2320 large Good Delivery gold bars. Likewise, 29 tonnes is a lot of gold bars for LPMCL members to have as a clearing float at the Bank of England.

Furthermore, if an AP had acquired newly refined gold from a refinery with the intention of delivering it to HSBC as part of the GLD security creation process, why would this gold be delivered to the Bank of England vaults, and not directly to the HSBC vault? It would be more practical to have delivered that gold straight to the HSBC vault.

Therefore, its plausible that at least some of the gold being held by the Bank of England as sub-custodian on behalf of the SPDR Gold Trust was sourced from gold borrowed from central bank gold holdings at the Bank of England.

Bullion Bars Database

There is further support for borrowed gold bars being held by the SPDR Gold Trust during Q1 2016.

Warren James maintains a database of the identities of the gold bars held in the GLD over time which allows comparisons between the gold bullion coming in and out of the GLD. Each bar has a unique signature based on its brand, serial number, and weight. Gold bars coming into the SPDR Gold Trust can be tracked based on whether these bars were previously held in the Trust or whether they are bars coming in that have never been held by the Trust before. When a bar returns to the list after it was previously held but disappeared from the holdings, it's called dark bullion since its identity is familiar but it's not known where the bar has been since it left the GLD and re-entered.

Up until 10 February 2016, the percentage of dark bullion bars re-entering GLD that had previously been held by the Trust was about 30% of the inflows. As the inflows into GLD rose sharply from the second half of February, dark bullion entering GLD essentially stopped and nearly all of the bars being added to GLD were bars that had never been held by GLD before. These inflows were a combination of newly refined gold and older bars which are no longer produced. For example, gold bars coming into GLD in February 2016 have included hundreds of bars from the US Assay Offices and Mints, AGR Matthey, Johnson Matthey Plc (Royston), the Australian Branch Royal Mint - Perth, Engelhard, Kazzinc etc, all of which are no longer produced.

The fact that a large amount of older gold bars arrived into GLD from the second half of February onwards would suggest that these bars came long-held holdings in the vaults of the Bank of England, and consisted of borrowed central bank gold.

Some Questions

All of the above poses a number of questions:

  • If this known 29 tonnes of gold was held by the Bank of England as subcustodian for GLD during Q1 2016 but not held by the Bank of England as subcustodian at the end of March 2016, did it physically leave the Bank of England vaults, or was it just transferred to HSBC's account at the Bank of England?

Note that nothing in the SEC filing rules or directives compels WGTS to specify if the GLD custodian HSBC is holding gold outside its own vaults, so in my view its possible that gold is held by HSBC on behalf of the SPDR Gold Trust at the Bank of England. Indeed, its possible that HSBC even leases vault space in the Bank of England vaults, a sub-leased vault facility. If the HSBC London gold vault is indeed in the location that's documented here (HSBC’s London Gold Vault: Is this Gold’s Secret Hiding Place?), then it would appear that it's not big enough to accommodate the entire gold bar holdings of GLD and all other HSBC customers' gold, especially when GLD holding are and were over 900 tonnes.

  • Since the Bank of England didn't hold any gold as subcustodian for GLD in fiscal 2015, but did in Q1 2016, how much of these large inflows of gold into GLD in Q1 and Q2 and July this year (documented above)  involved metal stored in vaults at the Bank of England? And why changed in the London Gold Market to require gold held at the Bank of England to suddenly be needed to fulfill GLD gold delivery obligations?
  • Why are LBMA practices and customs so lax that it allows HSBC the custodian, not to have written custody agreements with the subcustodians. Surely the US SEC should have picked up on this?
  • Why did the SEC not ask iShares (IAU (which has 3 custodians) and ETF Securities to also alter their SEC filings to reveal subcustodians holdings. And for that matter why did the SEC not ask iShares to amend its disclosures to specify subcustodians in the Silver ETF - SLV.
  •  Why do central banks never publish gold bar lists detailing the serial numbers of their bars, and why is the Bank of England so against allowing central banks to do so. There are a number of FOIA requests (including one I made) that providing evidence of the Bank of England refuses to allow central banks to publish weight lists / bar lists. Could it be that they do not want data on gold bar serial numbers going into the public domain as it would show that leased and swapped gold is being held by commercial gold ETFs?

Audits of the SPDR Gold Trust's gold bars

The SPDR Gold Trust 's gold bar holdings are physically audited twice per year. A partial physical audit is conducted in February/March of each year, and a full physical audit of the bars is done in September of each year. The current auditor is Inspectorate International Limited. In September 2015, Inspectorate conducted the 2015 full count of the Trust’s gold bullion held by the custodian HSBC London. That audit counted  54,807 London Good Delivery gold bars at the "London Vaults of HSBC Bank USA National Association".  Note that the official custodian of the SPDR Gold Trust changed from HSBC Bank USA to HSBC Bank Plc in late 2014, so this audit should really state HSBC Bank Plc.

Inspectorate then conducted a random sample count audit in early Mach 2016 at the "London Vaults of HSBC Bank Plc" based on a date of 19 February 2016. As of that date, the "account (GLD) held title to 56,913 London Good Delivery, large Gold Bars". However, this audit was "a statistically random count of 16,493 bars of gold", based upon the gold inventory as at 19 February 2016, and it was carried out between 29 February and 11 March "at the Custodian’s premises".

Given that the Bank of England acted as a subcustodian to the SPDR Gold Trust during Q1 2016,  the question arises as to whether  all of the other 40,420 (56,913 - 16,493) bars were at the “Custodian’s premises” during the audit,  or were some of these other bars being held in the Bank of England vaults. It's not clear why a random sample of 16,493 bars (about 206 tonnes, and 29% of the total holding) was chosen, but it's about 2/7ths of the gold bars held by GLD.

There is no mention of the Bank of England in Inspectorate's latest audit report. However, there is nothing to say that some of GLD's bars were not in the Bank of England at the time of the audit. The audit doesn't say so one way or the other, and the way its worded means that it doesn't say all of the inventory is at HSBC's vault, just that the audit was conducted at HSBC's vault.

Conclusion

Central banks continue to report leased and swapped gold (gold receivables) as an asset on their balance sheets. This accounting fiction, which doesn't follow any international accounting standards is a sleight of hand that allows the same gold to appear to be in two places at once. If gold bars that have been leased from central banks are being held in the SPDR Gold Trust, then these gold bars are being double-counted, and GLD shareholders should be made aware that the Trust is holding gold that has been ultimately borrowed from central banks. Using borrowed central bank in an ETF doesn't put the ETF on the hook, since the ETF owns this gold. But it does mean that the bullion banks will need to return the equivalent borrowed gold to the lending central bank from other sources. Importantly though, this type of activity will overstate the amount of gold held by the combined official sector and ETF sector.

The SPDR Gold Trust 10-Q for the 2nd quarter of 2016 will be filed with the SEC in about 3 weeks time, at the end of July. With the continuing large inflows into GLD in Q2 2016 it will be interesting to see whether the name of Bank of England as subcustodian of GLD reappears in the Q2 filing?

And if gold bars held by GLD are actually stored at the Bank of England vaults when the  full physical gold bar audit is conducted next September, surely the full audit report should require a passage to say that some of the gold bars audited were held at the Bank of England, and not just at the 'London Vaults of HSBC Bank'? Since the SEC have opened this issue, and created more questions than answers, perhaps it is now in the SEC's interests to go even further and ask World Gold Trust Services to fully clarify the matters raised above. Otherwise, the GLD gold bar holdings will continue to be a source of intrigue and debate in the gold world.


Sunday, July 10, 2016

How High Is “Sky-High” Silver?

Published here: http://redirect.viglink.com?u=http%3A%2F%2Fgoldsilverworlds.com%2Fgold-silver-price-news%2Fhow-high-is-sky-high-silver%2F&key=ddaed8f51db7bb1330a6f6de768a69b8

By David Smith, Originally Published on Money Metals Exchange

Now that the precious metals’ five-year cyclical bear market is acting like it’s been replaced by a vibrant bull run in the opposite direction (up!), many analysts who chided the ongoing rise in the mining stocks and metals that started in December 2015 are begrudgingly changing their “outlook” so they don’t get left behind.

Some veterans are holding to long-stated targets, while others are raising them as Mr. Market gives us new information.

hhish_graph

4th of July, 2016 Silver Fireworks (Courtesy barchart.com)

Perhaps the prediction laying claim to the most fascinating “sneaks up and gets you” was uttered by Franco Nevada Mining Corp. (NYSE:FNV) Co-Founder Pierre Lassonde, when gold was still trading in the mid-three digit area. Asked for his long-range forecast, he replied, “I believe that gold will have 3 zeroes after the first number – I just don’t know what the first number will be.” (This year, he opined that $8,000 is a reasonable expectation.)

Jim Rickards – the CIA financial warfare advisor recently interviewed on a Money Metals Exchange podcast and whose thoughts I have frequently cited – makes a strong case for $10,000 gold, primarily due to a gold revaluation by the world’s central banks.

hhish-Jim_Rickards

Financial system insider Jim Rickards sees $10,000 gold.

You might wonder why, if the price of silver is projected to rise so much, I am dwelling on the price of gold. The reason is the silver-gold ratio which computes at any given time the number of ounces of silver needed to buy an ounce of gold. During the last 50 years, this key ratio has risen from a 1979 low of 14:1, to a January, 1991 high of 100:1.

Currently about 67:1, it’s still relatively elevated (showing silver is relatively inexpensive) within its historical parameters.

Over the years, this key ratio has spent a great deal of time bracketed between 80:1 and 50:1. Considering this data, a $10,000 gold price would put silver priced between $125 – $200 an ounce.

At the apex of its last secular bull market in 1980, the silver-gold ratio weighed in at a hefty 14:1. If silver only got down to a 30:1 ratio, this would price our model at over $300/troy ounce. Leaving the ratio aside altogether and simply considering the 1980 inflation-adjusted price by itself would project a silver price today of more than $150 an ounce.

If you’d like a real heart-stopper (sit down first), then consider what John Williams at Shadowstats.com has demonstrated, using the government’s long-standing Consumer Price Inflation (CPI) calculation models (which have since been revised several times by the U.S. government to understate inflation). Williams calculates that the value of the “true” CPI-adjusted 1980 silver spike price high today, would be equivalent today to a silver price of… $470/ounce!

Most of our readers are familiar with many reasons the intermediate to long term bullish case for silver is exceptionally strong. Beyond these factors – not to mention the recent revision of silver supply data shows the poor man’s gold has actually spent more time in deficit than in surplus over the past decade and while the current silver-gold mining ratio is only 9:1 – comes another new and intriguing consideration…

Recently, First Majestic Silver (NYSE:AG) President Keith Neumeyer, made the following remark: We got approached by an electronics manufacturing company that manufacturers cell phones and computers about four weeks ago… There were three of them in the meeting and they wanted to bid on our silver… It’s the first time in the fourteen years that I’ve been with First Majestic that we’ve ever been contacted by an electronics manufacturer… That tells me there is something changing in the market.

Some Silver Price Projections by the Heavy Weights

Early this summer, Keith Neumeyer said that triple digit silver was in the cards, even if gold stays well below expectations. But if gold should go to $10,000, then “silver will be some ridiculous number… it could even be $1,000…”

First Majestic CEO expects triple digit silver prices.

First Majestic CEO expects triple digit silver prices.

Nick Laird: I find it interesting when Keith Neumeyer of First Majestic Silver, one of the largest silver producers, sticks his head out & says $140 silver, at the same time as Pierre Lassonde of Franco Nevada, one of the most successful gold entrepreneurs does the same in calling for $10,000 gold. Which would produce a 71:1 ratio which is a little below where we are today. At the top of the bull run, I would expect a ratio of perhaps 30:1 which means one of them needs to double his number.

James Turk: Silver is still in stage-1 of its bull market; the big price gains don’t start occurring until widespread participation by the public begins in stage-2, but that will not begin until silver breaks out of its base when $50 is eventually hurdled. With that event silver will start garnering worldwide attention just like gold started doing when gold entered stage 2 of its bull market by hurdling above $1000. (Turk has publicly stated he believes; we will eventually see $400 silver.)

Steve St. Angelo’s SRSRoccoReport.com chart below demonstrates how the massive multi-year upswing in American Silver Eagle sales is changing the landscape for investment demand – with a concomitant effect on supply. And keep this factoid in mind: though we don’t have a breakout handy for how much of the total demand is destined for other countries, we’ve been that informed that ASE’s are sold to at least 50 other countries. If this “foreign” Eagle demand-wave continues to build, sales of the iconic coin could shift into hyper-drive.

Holding silver will place you in good company with other Americans!

Holding silver will place you in good company with other Americans!

David Morgan (2002) of TheMorganreport.com: For the record, I will state there will be another, more frenzied scramble which will carry silver prices to highs that will repair all the excess paper money creation, price suppression, supply deficit, and bearish sentiment over the past two decades. This will become known as the Great Silver Crisis.

David doesn’t spend a lot of time guessing where the silver price will peak when this multi-year historic bull run starts to roll over, but neither is he shy about saying that “it will be one for the record books.”

And herein lies an important caveat for the rest of us. As precious metals insurance-holders and investors, we are better served by focusing more on the fact that silver is likely to go up a LOT, than by trying to divine by how much.

If we’re destined to see the very large and sustained up move I expect, then shrewd investors can achieve maximum gains by establishing a “silver stacking” program of regular dollar cost averaging, without paying too much attention to either the current price, or some distant projection. Leave the day-to-day predictions to the swing traders and crystal ball gazers, while methodically adding to your physical position. It’s a nice way to tame those pesky fear and greed investment dragons. Not to mention building over time, a good-sized pile of silver with the potential for gains that might just exceed your wildest imagination.

Steve St. Angelo’s chart above shows that Americans in greater numbers than ever are getting involved with the “silver story” by exchanging some of their paper promises for real, hold in your hand money: silver. If you’re new the topic, now’s a great time to get started. And if you’re already a stacker…well then just keep on keepin’ on!

hhish-David_SmithDavid Smith is Senior Analyst for TheMorganReport.com and is a regular contributor to MoneyMetals.com. For the last 15 years, he has investigated precious metals mines and exploration sites in Argentina, Chile, Mexico, China, Canada, and the U.S. and shared his findings and investment wisdom with readers, radio listeners, and audiences at North American investment conferences.


The ECB’s Bank Stress Test Shows Fatal Errors

Published here: http://redirect.viglink.com?u=http%3A%2F%2Fwww.zerohedge.com%2Fnews%2F2016-07-10%2Fecb%25E2%2580%2599s-bank-stress-test-shows-fatal-errors&key=ddaed8f51db7bb1330a6f6de768a69b8

SRISK 5

Source: riskdynamics.eu

The United States have learned from their bad experiences during the Global Financial Crisis wherein almost its entire financial system was going down in flames. Stress tests to find out how banks would be able to deal with economic adverse scenarios became mandatory, and the European Union followed suit with its stress tests in 2011, followed by a series of check-ups later on.

SRISK 4

Source: Daily Mail

Almost a decade has passed since the GFC, and half a decade since the European stress tests, but the volatility and unrest in the financial world has never been this high. You would think that five years of ECB-supported lending would have helped these banks (as even though the net interest spreads did decrease, the access to the ultra-cheap lending facilities of the ECB allowed the banks to continue to generate positive results), nothing has changed, and more than 5 years after the term ‘PIIGS’ became one of the most well-known words to describe the economic mess in the weaker European, one of the I’s is now once again in serious economic trouble.

SRISK 3

Source: Financial Times

The Bank of Italy has now publicly stated some of its banks will need more state support to merely stay alive as the position of these banks has been deteriorating since the Brexit vote. Some of the smaller ones have been forced to merge with each other to create larger companies which should theoretically be able to withstand economic shocks.

One would have expected the stress test of the ECB (with new results anticipated to be released at the end of this month), which was indeed focusing on how banks would deal with adverse economic scenario’s, and more importantly, how their capital ratios and balance sheets would hold up, would have taken care of the majority of these risks. After all, the banks had almost 5 years to hoard cash (by retaining their normal earnings) and to tap the market on opportunistic moments.

Banco Popolare is one of those banks which have been forced to merge with another company after the capital ratios were unsatisfactory. The bank has now raised 1B EUR in what seems to be an emergency capital raise. After all, the new shares were priced at 2.14 EUR, or approximately 50% lower than the share price before the announcement and even though it’s great to see a bank is able to raise cash, one really has to start to question these measures. But what’s even more scary is the fact the bank is now targeting a non-performing loan ratio of 18% by 2019, down from almost 25% in 2015. That’s right, the non-performing loan ratio was shockingly high at almost 25%...

SRISK 2

Source: Bloomberg

Banco Popolare was trading at in excess of 10 EUR less than a year ago, so why does the bank now have to complete an emergency capital raise? It’s definitely looking like the regulators were asleep at the wheel, as a capital raise right after the summer of last year would have been much more advantageous for this specific bank, reducing the dilution to just 20%  (instead of 120% now) to raise the same amount of money. Yes, the net income from the banks all over the Eurozone will be negatively impacted, but it’s pretty clear either nobody saw this coming, or nobody wanted to spoil the party that was going on on the financial markets last year.

This strengthens the thesis the ECB has used the wrong approach to stress test its financial system. Whereas the ECB used a top-down approach by checking how news macro-economic circumstances would impact the capital ratio of a bank, it would have made much more sense to use the SRISK method, developed by Acharya, Engle and Pierret, professors at the NYU Stern School of Business and the University of Louvain-la-Neuve.

The SRISK method uses a different approach, as it recalculates how much a bank would need to raise to maintain its capital ratios during worse economic times, and that might be more important to know than by how much the capital ratios will drop (after all, if these ratios drop, the banks will need to restore them rather than just ‘waiting’ for the economic headwinds to disappear). And this SRISK method tells you a completely different story, a story the ECB wouldn’t really want you to know, as it has been buried deep inside a working paper which discusses what the impact would be on the banks should the stock market fall by 40%.

SRISK 1

Source: ECB working paper

As you can see, under the SRISK method, several large banks will be more severely impacted compared to the ‘official’ stress test results of the ECB. The impact under the SRISK method will be more than 4 times higher for Banco Santander, BBVA, and ING than it would be under the ECB’s calculation method.

>>> The domino's are falling. Click here to read our Guide to Gold and protect your wealth

Secular Investor offers a fresh look at investing. We analyze long lasting cycles, coupled with a collection of strategic investments and concrete tips for different types of assets. The methods and strategies are transformed into the Gold & Silver Report and the Commodity Report.

Follow us on Facebook @SecularInvestor [NEW] and Twitter @SecularInvest

Friday, July 8, 2016

China Resumes Monthly Gold Buying in Bid to Diversify Reserves

Published here: http://redirect.viglink.com?u=http%3A%2F%2Fwww.zerohedge.com%2Fnews%2F2016-07-08%2Fchina-resumes-monthly-gold-buying-bid-diversify-reserves&key=ddaed8f51db7bb1330a6f6de768a69b8

Against the backdrop of ongoing geopolitical and financial market uncertainty the Chinese central bank has continued to add to their gold holdings in an effort diversify the reserves further.

As reported by Bloomberg, China, the world’s biggest producer and consumer of gold, added about 500,000 ounces to central bank reserves in June, restarting monthly purchases to diversify holdings after taking a breather in May.

A Chinese national flag flutters outside the headquarters of the People's Bank of China, the Chinese central bank, in Beijing, April 3, 2014. REUTERS/Petar Kujundzic/File Photo

The People’s Bank of China increased assets to 58.62 million ounces, or about 1,823 metric tons, from 58.14 million ounces in May when they were unchanged, according to data on the central bank’s website. The country has boosted its hoard in 11 out of the past 12 months after announcing a 57 percent increase to 53.32 million ounces since 2009.

China bought gold during a month when global prices climbed 8.8 percent, boosted by the U.K. vote to leave the European Union and a further scaling back of expectations for a rise in U.S. interest rates. Bullion has surged 29 percent this year as investors sought a shelter from market turbulence and increasing global economic and political risks. Assets in exchange-traded funds jumped 37 percent in 2016 to more than 2,000 metric tons.

 
The full report can be read here 
 

7RealRisksBanner


Gold and Silver News

Read More Here

Gold Prices (LBMA AM)
08 July: USD 1,356.10, EUR 1,224.83 & GBP 1,047.45 per ounce
07 July: USD 1,367.10, EUR 1,233.40 & GBP 1,052.80 per ounce
06 July: USD 1,370.00, EUR 1,239.71 & GBP 1,059.01 per ounce
05 July: USD 1,344.75, EUR 1,207.05 & GBP 1,023.89 per ounce
04 July: USD 1,348.75, EUR 1,213.07 & GBP 1,016.42 per ounce
01 July: USD 1,331.75, EUR 1,199.51 & GBP 1,001.34 per ounce
30 June: USD 1,317.00, EUR 1,183.59 & GBP 976.82 per ounce

Silver Prices (LBMA)
08 July: USD 19.72, EUR 17.82 & GBP 15.20 per ounce
07 July: USD 19.95, EUR 18.00 & GBP 15.31 per ounce
06 July: USD 20.43, EUR 18.46 & GBP 15.75 per ounce
05 July: USD 19.73, EUR 17.69 & GBP 14.99 per ounce
04 July: USD 20.36, EUR 18.31 & GBP 15.36 per ounce
01 July: USD 19.24, EUR 17.29 & GBP 14.48 per ounce
30 June: USD 18.36, EUR 16.48 & GBP 13.61 per ounce

Recent Market Updates

- Property Fund Turmoil in the UK has Eerie Echoes of Bear Stearns
- "In Gold We Trust" Annual Report - New Bull Market "Emerging"
- 3 Charts Show "How Precious Brexit Is" for Gold and Silver Bullion
- Gold, Silver Best Performing Assets In H1, 2016 – Up 26% & 38%
- Gold Surges to $1,313/oz – Fed Concerned Re Outlook, BREXIT and May “Consider Using Helicopter Money”
- Gold Prices Higher For 5th Session On BREXIT and FED

- Soros Buying Gold On BREXIT, EU “Collapse” Risk
- UK Gold Demand Rises On BREXIT “Nerves”
- Pensions Timebomb in “Slow Motion Detonation” In UK, EU, U.S.
- Silver – Perfect Storm Brewing in the Market
-  Martin Wolf: There Will Be Another “Huge” Financial Crisis


Thursday, July 7, 2016

The Number One Goal to Own Gold and Silver is NOT What You Think It Is

Published here: http://redirect.viglink.com?u=http%3A%2F%2Fwww.zerohedge.com%2Fnews%2F2016-07-07%2Fnumber-one-goal-own-gold-and-silver-not-what-you-think-it&key=ddaed8f51db7bb1330a6f6de768a69b8

The number one reason to buy physical gold and physical silver (not paper gold and paper silver, which is not the same thing) is very likely not what you think it is. I can deduce the number one reason why most people buy gold and silver simply from the disproprotionate amount of questions I receive about buying gold and silver whenever gold and silver prices are rising significantly versus when gold and silver prices are falling. In other words, most people believe that that top reason they should buy gold and silver is to profit from rising prices. However, this is far from the best reason to buy physical gold and physical silver. The number one reason to buy physical gold and silver, bar none, is the global currency rot that is happening today, that is relentless, and that Central Bankers are now helpless to stop (though they are responsible for creating it). Of course, some may say that benefiting from rising fiat currency prices of gold and silver is the same reason as protecting onself against currency rot, but in reality, these two reasons for buying gold and silver are as different as night and day, and here's why. Of those that want to benefit from rising fiat currency prices of gold and silver, the vast majority are looking for a quick score, and they buy gold and silver for this reason without even taking the time to truly understand the value of gold and silver. Those seeking a quick profit from ownership of gold and silver typically fail to understand that:

(1) the true value of gold and silver is immutable and defined by its weight in grams or troy ounces;

(2) that gold and silver should never even be priced in terms of illegitimate fiat currencies; and

(3) during periods of time when fiat currency prices of gold and silver drop, a dropping fiat currency price is only indicative of an incredible opportunity to buy similar values (weights) of gold and silver while spending less fiat currencies to do so.

As an example of this incorrect mindset, a the end of this past May, I informed a couple of friends that gold was making a short-term low at about $1200 and silver was doing likewise at $16. Because both PMs have risen considerably in fiat currency prices since then, one of these friends incredulously asked me at the start of this week if he should sell his gold and silver because both PMs had moved significantly higher in such a short time-span. In hearing this inquiry, I realized that he didn't understand the number one reason to buy physical gold and physical silver in the first place - the protection it affords all of us against Central Banker-induced global currency rot.


Everywhere you look, there are stories from every continent in the world regarding currency collapse and the hundreds of millions of lives ruined by Central Banker-created currency rot. Of course, you will never hear of this critical global issue promoted by the  banker-bought-and-paid-for mainstream media even though these unfolding tragedies should be front and center on page 1 as these are critical stories of which everyone should be aware. And because these stories are largely ignored by the banker-bought-and-paid-for mainstream financial media, this is the number one reason most people are shockingly unaware of the global currency rot that is happening right now. Fortunately, with a tiny bit of effort and just a little bit of research online, one can easily track down and uncover these stories.


If you haven’t been asleep for the last five years, if one knows nothing else about this super important story of global currency rot,  the main story of currency rot everyone knows about is the rapid collapse of the Russian ruble from about mid-2014 to the end of 2015. Since then, the ruble has recovered slightly, but not enought to save anyone that stored large amounts of their wealth in rubles during this time period. Many times, people make the mistake of thinking that because their domestic currency has only devalued slightly up until now, that there will always be time to exit the currency and move to a sound currency like physical gold and physical silver. Thus, they endlessly delay executing strategies they know they should have executed at least a year ago, due to this “slow burn” that can be quite deceptive. For example, from early 2012 to the end of 2013, over 2 years, the Russian ruble lost 3% of valuation against the US dollar, a “slow burn” that tricked many Russians into remaining complacent about their faith in an unsound fiat currency. And in the first 7 months of 2014, the ruble lost another 3%. Again, many Russians were unhappy with the devaluation of the ruble, but they felt as though they could live with such devaluation and would take action if it became necessary, thinking they could front-run the event, even though warning after warning and red flag after red flag in the form of ongoing devaluations had already occurred that should have prompted every ruble-owning Russian to convert their fiat currencies into the sound money of physical gold that was far more stable. Then, while most Russians were still ignoring all the previous warning signs from July to the end of the year in 2014, the ruble fell off a cliff and collapsed, rapidly lost a massive 50% in purchasing power, and unfortunately, for the procrastinators,  rapidly destroyed their savings in the process. In other words, by the time the “event” happened for which Russians were waiting to trigger action, it was already too late to act. What about those that converted rubles to gold in mid-2013 because they had the foresight to plan for the time in which Central Bankers would ruin the ruble fiat currency? From mid-2013 to present day, their gold, priced in rubles, has risen by about 120%, more than enough to preserve their purchasing power in their home country and more than enough to help them avoid the fate of most of their fellow countrymen that lost much of their life savings in a very short period of time.


Though there are literally dozens more examples I can provide that are comparable to the story above and I will provide one more example in this article of a failing emerging market fiat currency, people that live in industrialized nations tend to believe that there domestic currencies are “safe” because they fail to understand that Central Bankers are ruining currencies in every single country in the world today. They make a huge mistake of thinking “I don’t live in an emerging market, and that problem in Russia is an emerging market and third world country problem that will never happen in my country.” They further mistakenly believe, “A 50% devaluation of my fiat currency in 6 months can never happen. That is a problem of emerging markets and not industrialized, ‘modern’ markets.” Thus, they mistakenly conclude, with great confidence, that the process of fiat currency devaluation in their country will be much less volatile, and therefore provide them with much more time to react to the problem when it develops.  In other words, they believe that there is no need to plan because they can just react to warning signs in the future without realizing that multiple red flags and warning signs are already here. The free fall in purchasing power of the Ukranian hyrvnia, the Russian ruble, the Venezuelan bolivar and the very significant 20% to 30% devaluations of fiat currencies in several industrialized nations and dozens of other emerging markets ARE the red flags for which residents of industrialized countries are waiting, but have failed to identify.


Let’s use Canada as an example to make my point. No one ever thinks of Canada as anything but a modern, industrialized nation that would not suffer the same fiat currency problems as an emerging market country, and indeed, if you are not Canadian, you may be entirely unaware of the real and very significant struggles that have afflicted the Canadian dollar, or looney, in recent years. Like the Russian ruble, for the past two years, the Canadian dollar suffered some fairly significant swings in value against the US dollar but nothing that concerned most Canadians, though these swings should have been massive red flags to all Canadians of the already unstable nature of the looney. In 2011, the Canadian dollar swung 5% higher and nearly 7% lower from its starting point against the USD during the year but by year’s end was nearly unchanged, so most Canadians did not believe there was any need to diversify out of the Canadian dollar into a sound form of money like physical gold. The following year in 2012, during the course of the year, more red flags materialized as the volatility of 2011 continued, but again, the year closed with the Canadian dollar nearly unchanged against the USD, so most Canadians continued to ignore the massive red flag of currency volatility and instability, falsely believing that they still had time to respond reactively, instead of proactively, to the unstable Canadian dollar. However, as was the case with the Russian ruble, the fall came quick and hard for the Canadian dollar and in just 2-1/2 years, from mid-2013 to the end of 2015, the Canadian dollar plunged by more than 30% against the USD. Again, for those the Canadians that understood that Central Bankers are destroying fiat currency valuations in ALL countries and consequently moved out of the Canadian dollar intogold before this significant currency rot, their gold appreciated significantly in Canadian dollars over this same time period, helping to preserve one’s purchasing power, versus the substantial losses in purchasing power one suffered if one had just held devaluing Canadian dollars. If one needs to be reminded of how quickly a "strong" fiat currency (an oxymoron of word association) can unravel, merely recall the successful Brexit vote last month that caused the British pound fiat currency to plunge to 31-year lows in a single day.


Next, let’s look at the currency disaster that has afflicted citizens of Venezuela to provide a warning to everyone as to what they need to do to preserve their wealth during the continuing great currency rot and worldwide fiat currency collapse that is currently under way. In 2002, a USD could be exchanged for 1.6 Venezuelan bolivars. In April of 2016, many media sources reported that a dollar could be exchanged for more than 1,000 Venezuelan bolivars on the Venezuelan black market. Here’s how such a steep and rapid devaluation translates into real world problems. As of April 2016, Venezuelan media reported that a one kg bag of rice cost two days of wages for the average wage earner. And as of last month, the dailycoin.org reported that the average Venezuelan worker,  if they wished to buy a plane ticket to leave the country to escape this massive currency rot, would need to save two years of wages to purchase such a ticket! In other words, fiat currency collapse has ruined the life of the average Venezuelan. But what about those Venezuelans that took their cues from the currency rot events that had already been unfolding all around them and exchanged their bolivars into gold?  Within the past 5-1/2 years, gold priced in Venezuelan bolivars has soared by more than 444%, and this is just in terms of “official” government-set forex rates, which due to multiple “official” exchange rates, bizarrely range from 9 or 10 bolivars to several hundred bolivars per dollar. However, because the black market rate, as of Q1 2016, frequently reached in excess of 1000 bolivars per dollar, in essence, if one had changed bolivars into physical gold in Venezuela, and then sold some of this gold for US dollars to later be exchanged back into Venezuelan bolivars, not only would one be totally unaffected by the collapse of the Venezuelan bolivar, one would be prospering in such an environment of fiat currency collapse simply by having had the foresight to exchange intrinsically near-worthless bolivars into gold before the bolivar collapsed. And if no one wants Venezuelan bolivars, which is quite common, then one still owns gold, accepted as a universal money everywhere, or one can exchange gold into another fiat currency that is accepted. With the Venezuelan bolivar, this fiat currency is merely in the process of returning to its intrinsic value of zero, as is the destiny of all fiat currencies. In case one believes one is safe from our current orgy of Central Banker-induced fiat currency implosion by holding US dollars, remember two points.


One, the strongest option among a bunch of bad options is not a good option, and two, the destiny of all fiat currencies is to return to their intrinsic value of nothing, including the US dollar.


As I’ve stated above, procrastination is the enemy of wisdom, as procrastination in exchanging fiat currencies into sound money literally translated into an extreme difference between financial suffering and misery and financial prosperity in Venezuela today in less than a 6-year time span. Who will be the next country to become the next Venezuela? Most likely it will be another emerging market, but this probability does not negate the likely probability that these same problems will find their way back home to the industrialized nations that started these very problems as well (well, at least to the nations of the Central Bankers that rule these industrialized nations). And when it does, as we have all learned from the example of Venezuela above, you will either be prepared for it before it happens or try to react as it happens, but react too late,  and be wiped out financially.


The Central Banker destruction of all fiat currencies in every country of the world today demands a proactive approach and a reactive approach will fail.  


The example of Venezuela has taught us that we all have been provided ample and adequate warning to prepare for currency rot before it truly escalates in our own nation, but that shockingly, only a few among us will take the necessary actions  to survive it when currency rot rapidly escalates in our own country. Unfortunately, even those that see the beginning and intermediate stages of what has happened in Venezuela happening in their own countries, as is the currently the case in Canada, Australia, the UK, Portugal, Greece, Italy, Spain, Ireland, Kenya, Brazil, and on and on, likely will still ignore these red flags, simply because banker propaganda has prevented most of us from realizing the simplest of solutions – converting fiat currencies into the sound money of physical gold and physical silver.


In other words, not only is it human nature to not believe something can happen until it actually does happen,but it is also human nature to incredibly discredit an event as it unfolds before us, as long as it does not directly impact us significantly, until it invades our own personal space, directly affects us and denial of the truth is no longer plausible.


If you have read this article and are still skeptical, I urge you to study the current cases of fiat currency collapse that have happened/ and are happening right now in Venezuela, Russia, Mexico, Colombia, Argentina and Brazil. Studying and understanding the timeline of these currency collapses should truly awaken you to the very sobering probability of severe fiat currency devaluation and/or collapse in your country, no matter where you live.  Please refer to our prior two articles, “Three Charts that Show We’re Just Getting Started in the Second Leg Higher For All Gold and Silver Assets”, and “Why Intelligent Gold and Silver Mining Company CEOs are Deferring Sales of Current Production” to gain a fuller understanding of the global currency crisis.


To listen to a recent interview about where silver is heading, given by our Managing Director, JS Kim, to the SGT Report, click here.  Click here to learn more about the best junior gold and silver mining stocks in our Platinum Membership (mainly for accredited investors) and click here to learn about our flagship Crisis Investment Opportunities portfolio, up more than 16% in just the past month (3 June to 6 July). To be informed of our articles when we first release them (we originally released the above article on our website on 2 July 2016), please subscribe to our SmartKnowledgeU RSS feed. For occasional unpublished content, similar to this article, and unavailable anywhere else, sign up for our free newsletter.