Wednesday, December 23, 2015

Russia Gold “Buying Spree” Continues – Buy 22 Tons In November

Published here: http://www.zerohedge.com/news/2015-12-23/russia-gold-%E2%80%9Cbuying-spree%E2%80%9D-continues-%E2%80%93-buy-22-tons-november

- Russia adds another 700,000 ounces (22 tonnes) to gold reserves in November
- Russian ally Kazakhstan increased gold reserves for 38th month – to 7 Mil ounces
- Russia has added 197.1 tonnes in 2015 – Compared with 172 tonnes in all 2014
- November gold buying is Russia’s ninth straight month of increase
- Russia now has sixth largest gold reserves in the world
- Central bank buys all Russian gold production
- Other Russian gold demand imported
- Russia views gold bullion as “100% guarantee from legal and political risks”

RussiaReservesst20151219

Russia continues to add to its gold reserves and added another 700,000 ounces in November or another 22 metric tonnes, and analysts believe this buying will continue and may intensify in the coming months.

Russian ally Kazakhstan increased its gold reserves for a 38th month to 7.03 million ounces in November from 6.96 million ounces a month earlier.

The latest large increase in Russia’s gold reserves – a “buying spree” as reported onReuters Africa has again gone largely unnoticed by most analysts. Indeed, the important monetary and geopolitical ramifications continue to be largely ignored in western media.

Russia’s total gold reserves have now increased to 44.8 million ounces or around 1,392.8 metric tonnes, with a current value of just $48.3 billion. Russia’s total FX reserves are $371.2 billion and their gold allocation remains just 13% of their total reserves.

The share of gold in Russian foreign exchange reserves is much lower than in many other countries such as the U.S., Italy and France. Russian diversification into gold is likely to continue and could intensify if relations with the U.S. and NATO powers further deteriorate.

Russia still have less than a fifth of the gold reserves of the U.S. which are believed to be over 8,400 metric tonnes of gold. However, the U.S. has no foreign exchange reserves and is the largest debtor in the world – indeed it is one of the largest debtors the world has ever seen.

Russia now has the sixth highest gold reserves in the world – behind the U.S., Germany, Italy, France and China.

In 2014, Russia bought more gold in than in any year since the break-up of the Soviet Union. The country acquired over 173 metric tonnes according to World Gold Council figures. Reserve diversification intensified after April — averaging about 20 tonnes per month.

Russia gold buying has intensified in 2015 and now stands at 197 metric tonnes year to date.

Much of the gold bought likely came from Russian gold production which is currently at about 25 metric tonnes per month. In 2014, Russia was the third largest gold miner in the world at 266.2 tonnes, just six tonnes short of Australia in second place and China in first place.

Thus, the Russian central bank is generally consuming all of Russian gold production and sometimes having to import gold. Therefore, all domestic demand for gold and Russia is an increasingly wealthy nation with thousands of millionaires and hundreds of billionaires including mega rich oligarchs.

If any of these oligarchs decide to begin accumulating gold, then the already delicate supply balance in the physical gold market will be impacted resulting in much higher prices. It is worth noting that some of these oligarchs remain close to Putin and the Kremlin and thus this could be a coordinated strategy.

Clearly, Russia puts great strategic importance on its gold reserves. Both President Putin and Prime Minister Medvedev have been photographed on numerous occasions holding gold bars and coins as a display of economic stability and strength and the central bank declared in May 2015 that Russia views gold bullion as “100% guarantee from legal and political risks.”

Prudent investors are following Russia’s lead by diversifying and having an allocation to physical gold coins and bars.

MUST READ GUIDE: Gold and Silver Storage Must Haves
 

BREAKING GOLD NEWS and COMMENTARY TODAY – CLICK HERE


GOLD BARS AT 2% PREMIUM, FREE DELIVERY & FREE STORAGE FOR SIX MONTHS ON ORDERS BEFORE DECEMBER 31st
  • 2016 looks set to be stormy – never been a better time to buy gold
  • Gold bars (1 oz, LBMA) at just 2% on orders placed prior to December 31st
  • One of lowest premiums in market today for one ounce bullion coins and bars
  • 50% reduction in premium on these gold bars
  • Free storage for six months – allocated and segregated storage of your bars in safest vaults in world

* This is a phone offer only
** For storage – minimum order of 5 gold bars
*** For delivery – minimum order of 10 gold bars

Call Us Today To Secure Your Allocation

IRL +353 (0)1 632  5010
UK +44 (0)203 086 9200
US +1 (302) 635 1160

Tuesday, December 22, 2015

Precious Metals: Silver Prices Poised to Skyrocket in 2016

Published here: http://www.profitconfidential.com/silver/precious-metals-silver-prices-poised-to-skyrocket-in-2016/

Here’s Why I’m Bullish on Silver Prices
Silver prices remain down for the year, but don’t look away from the fundamentals. They suggests the precious metal could soar. Don’t be shocked if silver prices see a massive move in 2016 and beyond.

You don’t really have to be a rocket scientist to understand what’s happening in the silver market. We have a very basic economic problem at hand. The demand is soaring and due to lower silver prices, supply is facing severe headwinds. This is a perfect recipe for higher prices.

We have been paying.

The post Precious Metals: Silver Prices Poised to Skyrocket in 2016 appeared first on Profit Confidential.

Monday, December 21, 2015

Gold And Silver – Physical PMs Are A “Gift” At Current Levels

Published here: http://goldsilverworlds.com/gold-silver-experts/gold-and-silver-physical-pms-are-a-gift-at-current-levels/

It really matters little what the charts are saying about the paper futures for gold and silver here, which we will get to shortly.  The focus needs to be kept on a few facts that are inescapably true:  fiat currencies throughout the history on this planet have always, always failed, without exception, 100% of the time.  There are few situations for which such a statement of guaranteed [failed] performance can be made.

It is any different this time?  Yes and no. No, because all fiats have failed, plain and simple.  Yes, because the extent to which there is no reasonable reality in the relationship between paper and physical has never occurred to the current degree, ever.

In times past, gold and silver were used as a form of money somewhere in different parts of the world, but not today.  The Rothschild system of controlling the supply of “money” has been honed to [im]perfection where the world is dominated by the moneychangers, the entire world.  It is fiat, fiat, fiat.  No country trades using gold or silver as true money.  The moneychangers, the globalists have driven gold and silver out of everyday existence, physically, to a large degree, psychologically to an even greater degree.

In 2013, those calling for a change in the price direction for gold and silver for that year or at least into 2014, were proven wrong.  If not by 2014, then surely big changes would occur in 2015.  These expectations were being made by some of the smartest and most respected individuals in the PMs community.

Surely the reality of shrinking supply and unabated demand would prevail over the specter of unimaginable fiat production and phony central banker QE-to-infinity measures would mark 2015 for much-needed change in the failing world-wide financial system predicated on the privately controlled and managed Federal Reserve Note, commonly and mistakenly called the “dollar.”  One can legitimately question if any change will occur in 2016, at this rate.

The two things guaranteed in life have been death and taxes.  We add a third, the guaranteed failure of paper fiat.  When!  When!  When will the current fiat fail?  There is no known answer for that.

When will your life end?  There is also no known answer for that, either, other than the guarantee that it will.  Knowing you will one day die, does it stop you from living each day, each year as though life will continue?  It seems most people live their life that way.  While tomorrow is promised to no one, few expect that promise to arrive today or tomorrow, although it happens regularly throughout the world as people die every day.  Many make plans for their eventual death, in a variety of ways, family planning, estate planning, etc, but the hope is almost always that life will be extended for as long as possible.

This is the best analogy we can give for when the current fiat will fail, and it seems to be an apt one, just in reverse.  People want to see the death of the “dollar,” indeed all fiats, in favor of returning to some kind of gold standard.  When that happens,  those who have been buying and holding gold and silver over the years will see an increase in their wealth holdings.

You know death is inevitable, but you endeavor to live life to the fullest as best you can.  In the same vein, you know fiats fail, but not knowing when is less acceptable in that realm of the inevitable than not knowing when death will inevitably occur in life.  Still, one must plan for the purchase of physical gold and silver regardless of when the fiat will fail, as it will, and the current extraordinary circumstance, where the reality of supply and demand ceases to function, makes the ongoing purchase and holding of PMs more important than ever.

It is possible gold can still decline to 1,000 to 865, and silver to 12.50 to 11.70.  The probability remains greater than not, but a decline to those levels is no more a guaranty than death or taxes.  When the value of PMs do turn around and attain higher prices, more reflective of reality in the “unreal” world of fiat in which we live, having paid $1,800/oz, $1,200/oz, or $900/oz for gold, $50/oz, $35/oz, or $10 oz for silver will not be of much consequence if the pricing for gold and silver should reach 5 or tenfold multiples, or more, from current levels.

Those who already own gold and silver will stop complaining at those higher price levels.  That means anyone purchasing the metals at current prices, even if price continues lower over the next year, will be owning one of the world’s most reliable wealth assets at extraordinary prices.  Remember, price is a captive symptom of a highly irregular cause that is destined to fail.  Count on it.

There has been talk of a $20 handle for crude oil, and it is more than within the realm of probability.  If that turns out to develop, that weak rallies to the 50-60 area can be sold.

chart

There is no visible strength in gold, currently.  The reaction rally off the October swing low has been very weak, easily holding under the 1,100 level.  The fact that price has moved sideways for the past 6 weeks and has not been able to decline to the lower portion of the channel suggests a reaction rally could develop, but it would be normal activity within an established trend to the downside.

chart

While there can be an argument made for some kind of reaction rally to the upside, it is of less important than knowing that gold has not made a showing of a possible bottom, even while it is possible one could be forming.  It is not unusual for a bottom to take several weeks, sometimes a month or longer, to confirm itself, so patience is required to let the market do what is will do, regardless of personal sentiment or expectation.

chart
 

The chart comments contrast strong bullish fundamentals with the more reliable reality of price, price being the final arbiter.  One has to understand that the market is fully aware of all bullish supply/demand considerations, yet despite the overwhelmingly bullish read of the fundamental picture, price says otherwise, and ultimately, one can never argue with price.

Simply stated, the down trend has not yet run its course, at least in the paper market, which is what the charts reflect.

SI W 19 Dec 15

Given how trends serve as important information, and one should never position against one, there appears to be little need to be long in the paper market until there is more concrete evidence of a market turn.

chart

Silly Myths about Gold during Rising Interest Rates

Published here: http://goldsilverworlds.com/gold-silver-experts/silly-myths-about-gold-during-rising-interest-rates/

By Stefan Gleason of Money Metals Exchange

Fed Hikes; Silly Myths about Interest Rates & Gold Persist

sillymyths-aboutgoldThe Fed finally acted this week – upping its benchmark Federal Funds rate by 0.25%. Now that the speculation over whether the Fed will hike has been put to rest, analysts are busily speculating about what the Fed’s move means for the economy and markets.

Many of these speculations are unfounded. It’s time to bust some silly myths.

Much of what’s spewed out in the financial media concerning interest rates is flat-out wrong, especially when it comes to their impact on precious metals markets. Since gold and silver are small markets compared to bonds and equities, some “analysts” apparently think they don’t need to do actual research on precious metals markets before commenting on them. It’s easier to regurgitate oft-repeated myths about rising rates being bad for gold than it is to actually check the data.

Ahead of the Fed’s decision, the Wall Street Journal naively reported that “a shift to higher rates is expected to hurt gold, which doesn’t pay interest and costs money to hold.”

Setting aside the fact that not everyone who holds gold incurs storage fees (it costs you nothing to keep gold coins in your own house), let’s consider the core assertion that higher rates hurt gold. Recent history shows that assertion to be utterly false.

The Fed’s last rate-raising campaign occurred from June 2004 to June 2006. Over that period gold wasn’t “hurt” at all. In fact, gold prices rose from under $400 an ounce in June 2004 to over $700 by May 2006.

silly-myths-fredchart

The historic run-up in gold and silver prices during the late 1970s coincided with the most aggressive rate-hiking effort in the Federal Reserve’s history. By the time gold and silver prices peaked in January 1980, the effective Federal Funds rate stood at 13.8%!

The myth of rising rates being bad for hard assets persists in spite of data that show the exact opposite is true.

During periods when the Fed tightens, the best performing asset class by far is commodities. According to Allianz Global Investors, commodities have produced average gains of more than 25% when rates were rising, based on data going back to 1983.

Anyone who suggests that rising nominal interest rates make hard assets unappealing as investments hasn’t looked at recent history and doesn’t grasp that what matters are real (not nominal) interest rates.

When the nominal rate set by the Fed is lower than the rate of inflation, then real rates are negative. In an environment where the Fed funds rate shot up to 10%, but price inflation was running at 15%, then “doesn’t pay interest” gold would be fundamentally more attractive than cash at a -5% real rate.

silly-myths-quoteBut if at some point investors start expecting inflation rates to fall below nominal interest rates (real rates to turn positive), then investors might flee gold for interest-bearing instruments.

Recently, government-reported consumer price inflation rates have been extraordinarily low. The November reading on the Consumer Price Index showed price levels rising at an annual rate of just 0.5%.

The Fed’s 0.25% hike won’t in itself change much in the real economy. But it may get investors thinking about the possibility of inflation rates emerging from these lower levels. In the Federal Open Market Committee’s Statement following its decision to hike this week, the FOMC stated it was “reasonably confident that inflation will rise, over the medium term, to its 2 percent objective.”

The Fed noted that “monetary policy remains accommodative.” It vowed to continue reinvesting principal payments and rolling over its holdings of Treasuries, agency debt, and mortgage-backed securities. Its $4.5 trillion balance sheet won’t be shrinking anytime soon. Overall, the Fed’s Statement was widely interpreted as dovish.

Gold and silver prices both advanced on Wednesday following the Fed’s decision and then fell on Thursday. All the noise aside, there is plenty of fundamental support for the case that the metals are at or near a turning point.

Demand for gold and silver coins will set a record this year. Meanwhile, spot prices have traded below mining production costs for much of the year – presaging supply destruction in the months ahead. That is a far more important development in the outlook for precious metals markets than anything the Fed did or said this week.

stephan-gleasonStefan Gleason is President of Money Metals Exchange, the national precious metals company named 2015 “Dealer of the Year” in the United States by an independent global ratings group. A graduate of the University of Florida, Gleason is a seasoned business leader, investor, political strategist, and grassroots activist. Gleason has frequently appeared on national television networks such as CNN, FoxNews, and CNBC, and his writings have appeared in hundreds of publications such as the Wall Street Journal, Detroit News, Washington Times, and National Review.

Gold & Silver Prices Will Surge On Fundamentals Not Technical Analysis

Published here: http://www.zerohedge.com/news/2015-12-21/gold-silver-prices-will-surge-fundamentals-not-technical-analysis


Hold your real assets outside of the banking system in a private international facility  -->  http://www.321gold.com/info/053015_sprott.html 


Gold & Silver Prices Will Surge On Fundamentals Not Technical Analysis

Posted with permission and written by Steve St. Angelo, SRSrocco Report (CLICK FOR ORIGINAL)


Don’t be confused.  Gold and silver prices will skyrocket in the future based on the fundamentals, not technical analysis.  Not only will fundamentals be the important factor in the future, they have also been the leading indicators over the past 50 years.

I realize I will get a great deal of flak for stating this, but the facts presented below paint a pretty clear picture.  Now, while it’s true that the many of the gold and silver analysts (including this independent analyst) under estimated the level at which the Fed and Central Banks could prop up the Greatest Ponzi Scheme in history… it’s better to have ones precious metal insurance a bit early than late.

I wrote this article in response to one of the guests on Al Korelin’s radio show.  It was Avi Gilburt of ElliotWaveTrader.net.  Avi told Al Korelin that the bottom of the precious market was around the corner.  He said the four-year correction was nearly over and the next precious metal bull market was close at hand.

That sounded real nice until you read his recent article, Stop The Insanity As Misinformation About Gold Continues To Reign.  Here is how Avi views most of the gold and silver (bug) analysts:

Why is it that most who are followed in the metals market and viewed by many as “experts” are so horribly wrong week after week, yet continue to present the same analysis week after week? Are the majority of the participants in this complex really that foolish to continually follow such clearly erroneous perspectives with the “hope” that it will eventually be right?

Avi’s comment here actually sounds logical to many precious metals investors who bought metal at higher prices hoping a recovery was soon at hand.  Unfortunately, as gold and silver prices continued to decline, investor frustrations increased.  While gold and silver analysts can be guilty of being wrong on the timing, they won’t be wrong on the FINANCIAL EVENT OF A LIFETIME.

I want to take certain parts of Avi’s article and show evidence why the fundamentals are the driving force in the value of gold and silver, not technical analysis.

FUNDAMENTAL #1 The Key Driver For The Precious Metals Prices

In his article, Avi made this remark about the precious metal bull market:

I want to start by saying that, yes, this 4+ year correction will conclude soon. So, this market will begin another bull market in the not too distant future. You see, markets, over the very long-term, will continue to rise, as society continues to progress throughout history.

Avi believes the precious metal bull market will begin shortly and will continue to rise as society continues to progress throughout history.  I don’t know if we will experience a long-term bull market, but rather a rapid rise in the value of gold and silver seems more likely.  Furthermore, the notion that society and markets will continue to rise in the future indefinitely doesn’t seem likely either.  I will discuss this at the latter part of the article.

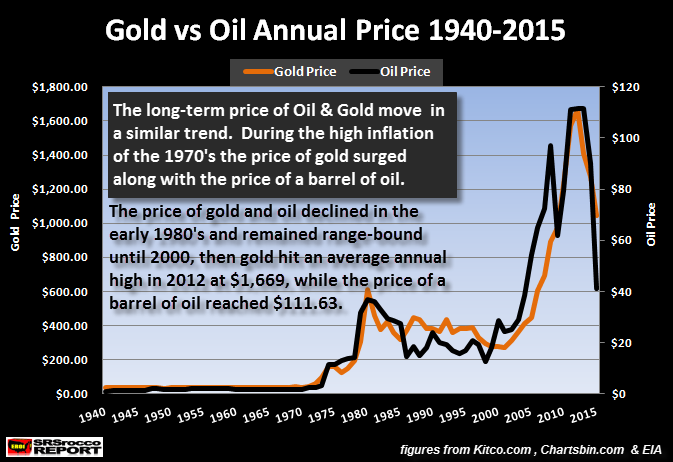
I put this chart together (below) to show why the price of gold behaved a certain way since 1940.  You will notice two lines in the chart.  One shows the price movement of gold and the other of oil.  If you look at the price of gold and oil from 1940 to 1970, they are basically flat-lined…. dead.  Nothing going on there:
However, two amazing things took place in the beginning of the 1970 decade.  Everyone knows Nixon dropped the Gold-Dollar peg (1971), but what was the other?  U.S. domestic oil production peaked in 1970 and begin its inevitable decline.  This caused serious consequences that were felt a few years later during the Arab Oil Embargo:
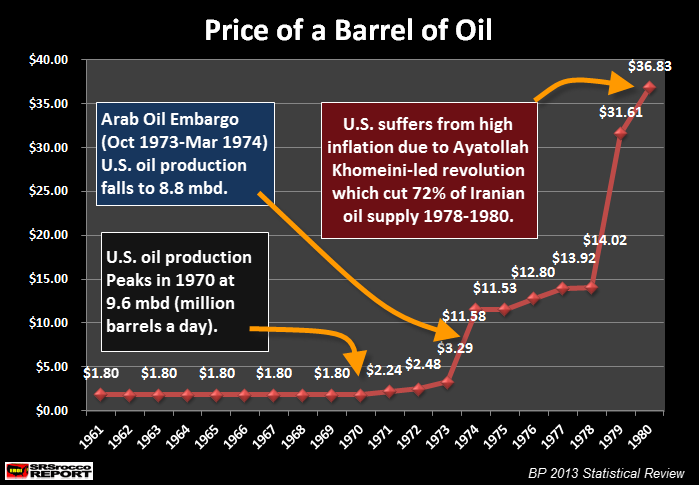
During Arab Oil Embargo, the price of oil shot up from $3.29 in 1973 to $11.58 in 1974.  Then during the Ayatollah Khomeini-led revolution, Iranian oil production declined 72% from 1978 to 1980.  This had a profound impact on the price of oil as it skyrocketed from $14 in 1978 to over $36 in 1980.  Please look at the next two charts and see how this impacted the price of gold and silver:
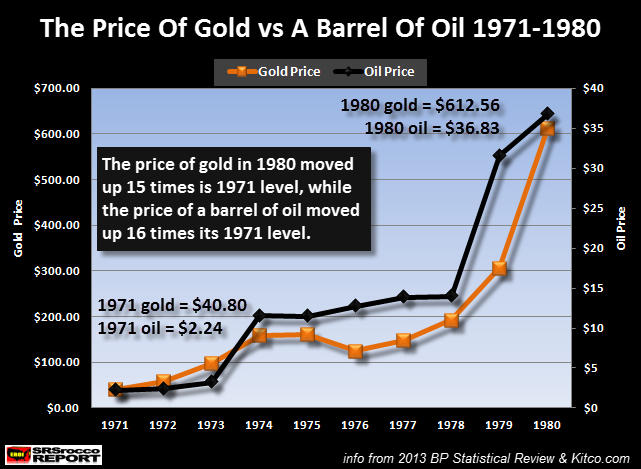
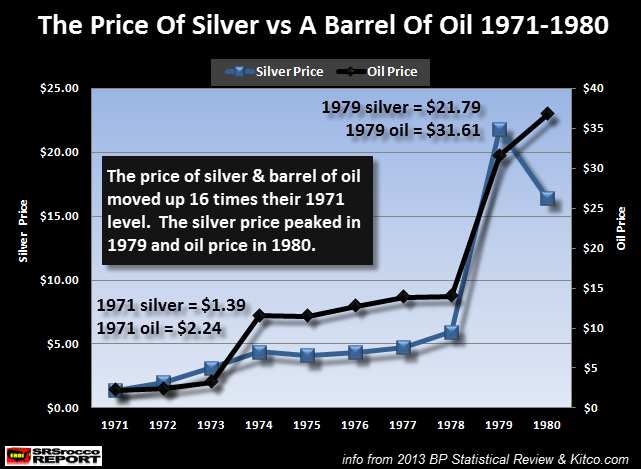
While analysts continue to regurgitate that the rapid rise in the price of silver during the 1970’s was due to Hunt Brother buying, who in the living hell was buying gold and oil to drive up their prices??  Never get a good response for that question.

Regardless, the price of oil increased 16 times its 1971 level, silver shot up 16 times and gold jumped 15 times.  Interesting that the precious metals moved up about the same percentage as oil.  Wonder how technical analysis could forecast the peak of U.S. oil production, the Arab Oil Embargo and the Iranian Revolution.

The same thing happened to the price of gold and silver from 2000 to 2012.  As the price of oil shot up from $24 in 2001 to $111 in 2011, the price of gold and silver surged to a record high of $49 and $1,900 respectively.

Let me show you the same Gold vs Oil chart from above:

After the huge rise in the gold and oil price in the 1970’s, they both declined and traded in a range-bound fashion for the next two decades.  It wasn’t until the rapid rise in the price of oil from 2004 until 2011, did the price of gold hit new highs.

Again, the huge increase in both the price of silver and gold were not due to technical analysis or another overdue “Bull Market”, but rather from the fundamental change in the energy market.  Investors need to realize ENERGY DRIVES the markets, not FINANCE.

FUNDAMENTAL #2:  Peak Oil Will Destroy The Market & Most Financial Assets

The one fundamental that Technical Analysts can’t chart on their graphs is the impact of peak oil on the value of most assets (or supposed assets) going forward.  What we are heading into is much worse than anything Technical Analysis can forecast.

Unfortunately, most people still don’t realize the implications of peak oil.  The valuations of most financial assets are based upon a financial principle called “Net Present Value.”  Basically, it’s like a time machine.  A current stock price is based on future earnings.  Future earnings are based on economic growth.  And economic growth is based on burning energy.. and not only energy, but a growing energy supply.

Jean Laherrere was kind enough to send me his updated Bakken Oil Chart.  But before I show that chart, let me show the North Dakota oil production chart he sent me several months ago:
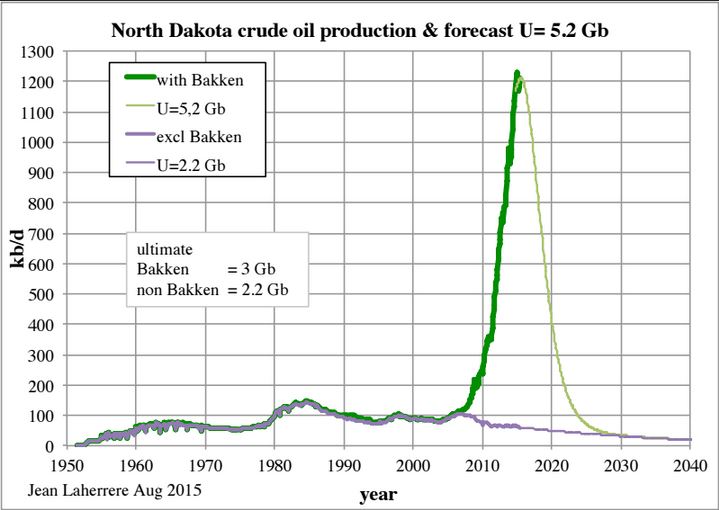
As we can see, the Bakken is the major portion of North Dakota’s oil production.  The chart of Bakken shale oil production (green) has gone up almost exponentially.  And, what goes up exponentially, comes down exponentially.  According to Jean’s calculations (based on ultimate reserves), is that Bakken oil production will fall below 100,000 barrels per day by 2025. 

Here is his updated chart of North Dakota and Bakken oil production:
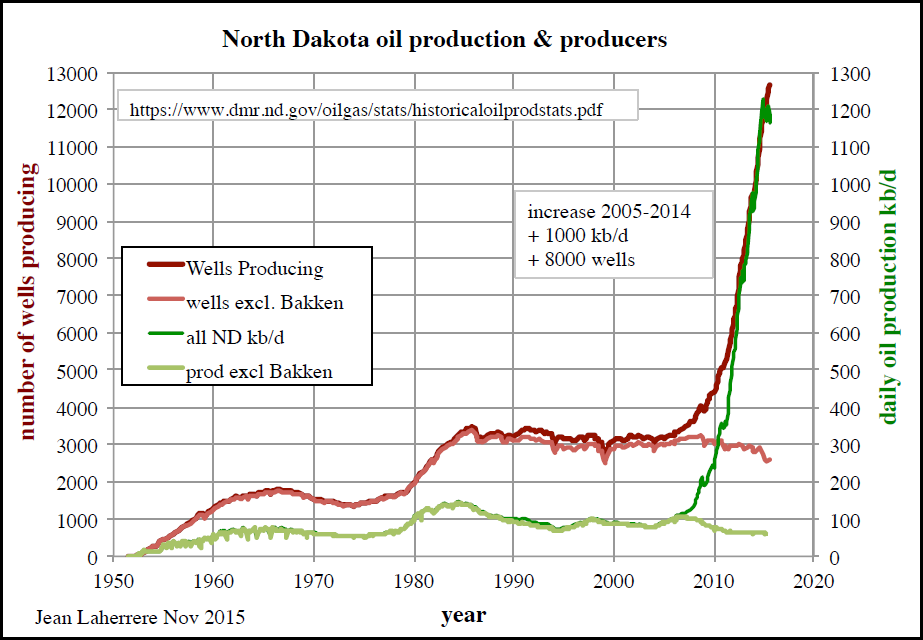
Again, the (dark) green is Bakken oil production and the red is number of wells producing.  You will notice something interesting happened at the top of the graph…. production (green) started to decline, while wells producing (red) continue higher.  Thus, overall oil production is now falling while the number of wells grow.  This is not a good sign.

We can see the peak more clearly in Jean’s final chart:
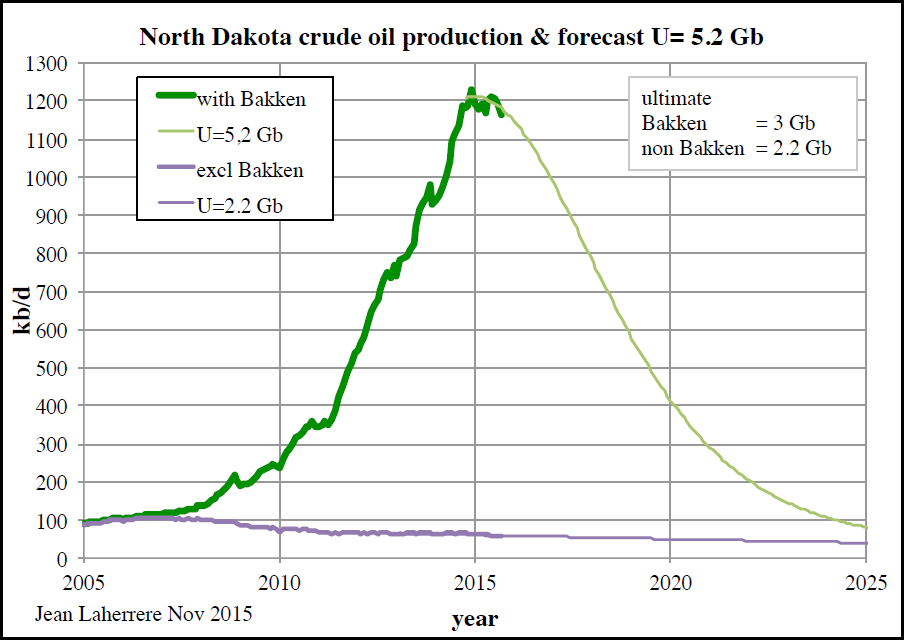
Now, while this is only showing the peak and decline of North Dakota (mostly Bakken) oil production, the other major shale oil fields in the United States will follow suit.  When 2016 rolls around, we are going to see serious fireworks in the U.S. Shale Oil industry.

Last week I spoke with a gentlemen who is the president of his own independent oil company in Texas.  He’s an oil geologist looking for conventional oil projects and knows just about everyone doing the same type of work in Texas, Oklahoma and Louisiana.  He told me that the current situation in the U.S. oil industry is worse than what took place in 1985.

He went on to say there was serious trouble ahead next year for the medium and small oil-gas companies.  Furthermore, he said that he couldn’t start working on new conventional oil projects unless the price of oil reached $60-$65.  It’s now trading at $39, and looks to go much lower.

In addition, the only reason the world was able to afford high oil prices was due to the massive increase in debt.  I recently came to the realization, from the work of Gail Tverberg at Our Finite World , that the higher the price of oil goes, the higher the amount of debt that is needed.  Which means, low or zero interest rates had to follow as this massive amount of debt is not serviceable at mid-high interest rates.

I will write more about DEBT-OIL-GDP in future articles.  But, please understand that the massive amount of debt is not sustainable and a collapse is certain.  Moreover, once this debt implodes or is written off, then U.S. and global oil production will collapse as the market can’t afford mid-high oil prices without adding even more debt.

This is the reason the value of most financial assets will implode.  Unfortunately, I do not have a crystal ball as to know when it will occur, but we are witnessing current market volatility and geopolitical insanity due to peak oil… whether we realize it or not.

FUNDAMENTAL #3:  Peak Oil Makes Technical Analysis Completely Worthless

Avi Gilburt stating this toward the end of his article:

Folks, belief in fundamentals, physical demand, production, war, etc. have not and will not provide you insight into the turning point for gold. Gold will not bottom until the sentiment for it has gotten so bad that it will have only one way left to go. That is simply how markets work. Period. End of story. No exogenous event or fundamentals will change that, and if you have not learned that the hard way over the last 4 years, then there is truly no hope for you, or anyone you chose to follow. Yes, I know some of you will view me as harsh, but someone has to sound the wake-up call for the zombies that populate this market.

Avi says that no “exogenous event or fundamentals” will change the gold market.  Well, I just showed during two-time periods when exogenous events (1971-1980 & 2001-2011) did impact the prices of gold and silver.   Anyone with a heartbeat and decent eyesight can tell from the Gold vs Oil Chart 1940-2015, that the price of oil had a direct impact on the price of gold.

As I have stated several times, the coming surge in the value of gold and silver will occur during the collapse of the Greatest Financial Ponzi Scheme in history.  This collapse will occur as we experience a precipitous decline of U.S. and global oil production.  So, the price of oil will no longer be a factor in determining the price of gold and silver going forward… it will be the fall and collapse of U.S. and global oil production.

People need to realize that the Fed and Central Banks can’t raise interest rates because we don’t have a CHEAP GROWING ENERGY SUPPLY.  Where do you all think the “Interest” comes from??  Do you really think interest on a loan or bank account comes out of THIN AIR??  It comes from a growing energy supply.

IMPORTANT:  The Fed and Central Banks had to increase debt to continue growth.  To get growth, you need a growing energy supply.  To get a growing energy supply, we needed higher oil prices.  To get higher oil prices, the Fed and Central Banks had to add a larger amount of debt.  By adding more debt on top of more debt, INTEREST RATES had to fall because the service on the debt was unsustainable.

Can you imagine if the Federal Reserve and U.S. Treasury normalized interest rates?  The annual U.S. interest payments on the debt would be over $1 trillion.. or more.  How will this interest be serviced as U.S. oil production heads into the crapper??

You see, this sort of fundamental approach to forecasting in a peak oil environment can’t be charted using Technical Analysis.  While I don’t know the date when the value of gold and silver will reset to substantially higher prices, it’s a matter of years, not a decade.  Once U.S. oil production starts to fall precipitously over the next several years, this will put severe stress on the highly leveraged U.S. Financial Industry.

Lastly, the notion that we are going to see society continue to progress in the future is a lousy one indeed.  I would imagine any ancient Roman wise enough to make this same prediction back before the Empire collapsed as the great city fell from a population of one million down to 12,000, would have sounded like a real KOOK.

I truly believe the world will be a much different place by 2025.  This will not be due to technical analysis, but the fundamental peak and decline of U.S. and global oil production.  Investors waiting for bottoms and corrections in paper assets via technical analysis will wish they spent more time focused on owning physical precious metals.


Please email with any questions about this article or precious metals HERE


Gold & Silver Prices Will Surge On Fundamentals Not Technical Analysis

Posted with permission and written by Steve St. Angelo, SRSrocco Report (CLICK FOR ORIGINAL)


Independent researcher Steve St. Angelo (SRSrocco) started to invest in precious metals in 2002. Later on in 2008, he began researching areas of the gold and silver market that, curiously, the majority of the precious metal analyst community have left unexplored. These areas include how energy and the falling EROI – Energy Returned On Invested – stand to impact the mining industry, precious metals, paper assets, and the overall economy.

You can find many of Steve’s articles on many noteworthy sites. Visit Steve at https://srsroccoreport.com.


Sunday, December 20, 2015

Wait A Minute... Why Is The Fed Continuing QE?

Published here: http://www.zerohedge.com/news/2015-12-20/wait-minute-why-fed-continuing-qe

Janet-Yellen

It wasn’t a big surprise for the financial markets to see the Federal Reserve hike the interest rate by 0.25% last week, and the stock market moved swiftly higher on the back of this announcement which has removed some uncertainty.

Federal Reserve Interest Rates

Source: propertyobserver.com.au

As expected, the interest rate was hiked by 0.25% citing better circumstances on the US labor market, and this move was widely anticipated and expected. What’s more important than the effective rate hike, are the comments surrounding this decision. The Federal Reserve has acknowledged the inflation rate hasn’t reached the eyed 2%  yet (well, at least not officially), and it will continue ‘to monitor actual and expected progress toward its inflation goal’. The choice of words is pretty important as the Federal Reserve also said it expects the economic conditions to remain ‘evolve in a manner that will only gradual increases in the federal funds rate’. In other words, the American economy isn’t ready yet for more rate hikes, and that’s the main reason why the markets were so enthusiast right after the announcement was published.

Maybe even more important was the statement in the final paragraph, which was a real ‘aha-erlebnis’. Despite increasing the interest rate, pretending the situation of the American economy is much better now, the Federal Reserve said it would continue to reinvest the proceeds of the maturing agency debt and mortgage backed securities as well as the income on existing securities into new ones. This basically is a continuous ‘soft’ Quantitative Easing, something we already pointed out in a previous column, published in October 2014.

Federal Reserve Balance Sheet

Source: Federal Reserve

As you can see on the previous image, the total value of the mortgage-backed securities on the balance sheet of the Federal Reserve continues to increase. Yes, it has slowed down, but if you’d zoom in on the one-year chart, you’ll clearly see the Fed’s balance sheet is still expanding and since the first week of May, the amount of MBS’ on the balance sheet has increased by an additional 2%.

Fed BS 2

Source: Federal Reserve

And if you’d look at the size of the total balance sheet of the Federal Reserve, you’ll clearly see the balance sheet hasn’t been reduced but actually has increased in the past few months. Granted, the increase is less outspoken, but the total balance sheet has expanded by roughly 1% in the past six months. Not exactly a clear sign the Federal Reserve ‘really’ believes in the US economy.

Federal Reserve Total Assets

Source: Federal Reserve

This could be seen as an indecisive move by the Fed, and the rate hike is partly being compensated by the Fed’s continuous involvement on the mortgage and asset backed securities as the total value of the MBS on the balance sheet continues to increase, as does the total amount of assets on said balance sheet.

The first step to try to convince the world (and probably themselves as well) the American economy is doing just fine has been made, but we aren’t confident to see additional steps anytime soon.

>>> Protect Your Wealth: Download our Exclusive Gold Report

Secular Investor offers a fresh look at investing. We analyze long lasting cycles, coupled with a collection of strategic investments and concrete tips for different types of assets. The methods and strategies are transformed into the Gold & Silver Report and the Commodity Report.

Follow us on Facebook @SecularInvestor [NEW] and Twitter @SecularInvest

Friday, December 18, 2015

Japan Still Leads The Way Towards Our ENDGAME

Published here: http://www.zerohedge.com/news/2015-12-18/japan-still-leads-way-towards-our-endgame

japan_SI

Successful investors live by a golden rule: what the mainstream financial media talks about is not important. They focus on what they don't hear instead. So forget about Yellen for a second. Let go of Draghi, oil, the South African rand and Syria. That's all in the now. But investing is about the future.

We are convinced there is one proverbial elephant in the room in particular that will shape our future. And that elephant is Japan. The 'widowmaker' trade has been claiming financial lives for multiple decades now. That is, short JGBs, or Japanese Government Bonds, was so obvious a trade that it never worked. The 10-year yield currently trades at 0.3%, which is close to the all-time low. We're still waiting for the shoe to drop.

Will it ever drop? We believe it will. 'Drop' might not be the appropriate word. The accumulation of imbalances might trigger a cascade of events that will shake the world at its core. Let's investigate some data.

Schermafbeelding 2015-12-18 om 23.06.30

Japan's debt-to-GDP ratio has hit a unprecedented 230%. You probably knew that. But it doesn't keep you awake at night. We are genetically wired to focus on acute danger. If a tiger approaches us, we focus. But if stands still and doesn't move for years, we turn around in search for other dangers. Wise investors remind themselves constantly of the tiger though. They never let their guard down.

What about the pace at which debt-to-GDP is ramping up? The budget deficit tells us all we need to know.

Schermafbeelding 2015-12-18 om 23.06.52

For six years in a row already, Japan scored around minus 8%. And given the flattish GDP, these annual percentages head straight to the public debt pile. Japan's long term potential real GDP-growth rate is simply close to zero, given the demographics. The latest quarterly print was a minus 0.3%. This makes the debt grow even faster.

The GDP leads us to the approach that governments used time and again in history to reduce debt loads: nominal GDP-targeting. Also known as inflation-targeting, financial repression, money printing, and monetary stimulus. The Bank of Japan (BoJ) is working hard in that respect. It already owns over 30% of the total JGB market. In a few years, Japan Macro Advisors (JMA) projects the BoJ might be holding over 60% of the total market given its current policies.

japan_1

What does that look like from a total balance sheet-perspective? With the BoJ also buying all kinds of non-JGB assets, the other central banks' balance sheets just pale in comparison. We are witnessing a truly historic experiment.

japan_2It doesn't take an Einstein to figure out that this is totally unsustainable. The BoJ-policies will have consequences. The most likely scenario is that inflation slowly develops at first. Commodity prices could turn. The yen could take another beating. And then suddenly, inflation accelerates.

Now, there has always been a lack of 'demand' for stuff in Japan. It has always been lucrative to hold cash. Yens were safe. Every year, you could buy more stuff. But as inflation develops, the growing flock of elderly will realize their government benefits are just paper promises. When the price of everything rises, as already happened in the Japanse stock market, they will realize their savings are losing value. Money will then become the hot potato. The velocity of money will rise. Suddenly, 'demand' will appear. Inflation accelerates

Hyperinflation is a possibility. It is not yet well-understood how this develops. There are multiple theories on the process. But historically, nearly all hyperinflations have been caused by government budget deficits financed by money creation. And that condition for sure is present in Japan.

Once the bond market realizes what is happening, the game is over. The JGB market will crash. The 'widowmaker' will make millionaires of the ones still hanging on. There will be a fiscal crisis. Panic develops. A banking crisis ensues, as yen denominated asset prices and the yen itself both crash.

Japan leads the way

The most scary prospect is that Japan is our leading indicator. Remember what we heard after the financial crisis. The US was not Japan. Europe was not Japan. There was not going to be deflation here. We were smarter. We learned Japan's lessons. Well, as we're heading into 2016 you would be hard-pressed to find anyone who would deny that the US, and especially Europe, both struggle with anemic growth and deflation. Despite all the extraordinary efforts of the Fed and ECB.

Japan does lead our way. One morning, Japan's experiment will reach its logical conclusion. The sun will rise in the East and the world will be a different place. That morning might arrive sooner than you think.

>>> Protect Your Wealth: Download our Exclusive Gold Report

Secular Investor offers a fresh look at investing. We analyze long lasting cycles, coupled with a collection of strategic investments and concrete tips for different types of assets. The methods and strategies are transformed into the Gold & Silver Report and the Commodity Report.

Follow us on Facebook @SecularInvestor [NEW] and Twitter @SecularInvest

Thirty Years of Zero Price Discovery in Silver

Published here: http://www.zerohedge.com/news/2015-12-17/thirty-years-zero-price-discovery-silver


Hold your real assets outside of the banking system in a private international facility  -->  http://www.321gold.com/info/053015_sprott.html 


Thirty Years of Zero Price Discovery in Silver 

Written for Sprott Money by Jeff Nielson (CLICK FOR ORIGINAL)


Thirty Years of Zero Price Discovery in Silver - Jeff Nielson


recent commentary presented readers with a shocking reality for which there was finally unequivocal data: there has been a supply deficit in the silver market for roughly thirty consecutive years. Such a deficit is unprecedented in the history of human commerce. Indeed, in almost any other market, it would be absolutely impossible.


What is necessarily implied by any supply deficit? Demand exceeds supply, and excess demand can be met only by encroaching upon stockpiles. Only one other commodity market on the planet has sufficient stockpiles to supply the market through thirty consecutive years of supply deficits: the gold market.


What makes precious metals unique in the world of commodities is that they are “precious,” and they tend to be conserved (and hoarded). This is still a reality for gold, but in recent decades the world has been “consuming” silver. That is, using it in small quantities in countless billions of consumer products and then throwing it away in landfills.


However, for thousands of years the world produced silver but did not consume it. Thus, like with gold, the world has (or had) large stockpiles of this precious metal, and those stockpiles have sustained global demand through three decades of supply deficits. But all stockpiles are finite. Indeed, known stockpiles of silver (primarily government holdings) have dried up, and official sales from silver stockpiles are now near zero.


It is for this reason that earlier commentaries have postulated the existence of a “secret stockpile” of silver. There was a cataclysmic 90% plunge in silver inventories from 1990 – 2005 that projected a formal default in this market in 2007, yet no collapse has occurred. The roughly one billion ounces of additional silver required to keep this market supplied had to come from somewhere.


Note how the mere existence of large stockpiles creates the potential for price manipulation. As already explained, in virtually every other market, stockpiles are very limited (in relative terms). Even a couple of consecutive years of supply deficits would put significant stress on those stockpiles, and that “stress” manifests itself in the form of upward pressure on prices.


Where large stockpiles exist, however, such supply/demand dynamics do not exist, and thus neither does the pressure necessary to correct the imbalance between supply and demand. This pressure is known, in economic terms, as “price discovery.”


How is a supply deficit corrected? Buyers and sellers meet in the marketplace. During this commerce, it becomes apparent that the current demand exceeds the current supply and that buyers are competing for insufficient supply. Inventories are depleted, and stockpiles are encroached upon.


What is the definition of a “stockpile?” It is a reserve of some particular commodity that may become available, but only at higher prices. Price discovery is the process by which excess demand leads first to encroachment upon stockpiles and then to higher prices. Through legitimate commerce, buyers and sellers jointly discover that higher prices are necessary to restore balance to the market.


How do higher prices restore balance ? Simple. Eventually, as prices rise, buyers become discouraged by the higher price, and demand falls. As prices continue to rise, more producers enter the market, enticed by the potential for profit, and supply rises. Supply meets demand, and balance is restored.


This is why price discovery is an absolutely crucial mechanism in all markets. This is why price discovery is automatic in all legitimate markets. This is why thirty consecutive years of supply deficits in the silver market is supposed to be an impossibility. Price discovery must correct any supply/demand imbalance in any market in the short (or, at most, medium) term.


Despite these economic dynamics that are automatic in any legitimate market, there has been no price discovery in the silver market for three decades. Because price discovery must occur in all legitimate markets, this alone is proof that we do not have a legitimate silver “market” and have not had a legitimate market for (at least) thirty years.


Instead, what we have is a facade. We have a crooked price-suppression operation disguised as a “market.”


How? How could we have gone from a “free and open market” for silver to a closed, systemic, price-suppression operation? This brings us to the banking crime syndicate’s premier tools for market manipulation: futures trading and short selling.


First, we’ll define the terms. “Futures trading,” very simply, means turning a market into a casino. What is a “futures” trade? It is a bet on the future price of that good/commodity.


Why would our governments have permitted the creation of these casino-markets? The irony here would be hilarious if it were not so perverse. It was (surprise!) the banking crime syndicate that lobbied relentlessly for the creation of these casino-markets.


The pretext given by the One Bank for the necessity of futures trading was to improve price discovery in our markets. The reality, as we have seen for three decades with silver, is that futures trading is a corrupt form of gambling that can be (and has been) used to prevent price discovery in markets.


How does (corrupt) futures trading operate to prevent price discovery? Just ask Jeffrey Christian of the CPM Group, an ex-Goldman Sachs banker. When this self-proclaimed expert on the precious metals markets was testifying before the Commodity Futures Trading Commission (CFTC) in 2010, he astounded the world. Christian proclaimed that what the bankers called the “market” for gold and silver was only 1% actual metal, while the other 99% was the paper-gambling of the banking crime syndicate.


The CFTC is the supposed “regulator” of the U.S. casino-markets, the largest (and most corrupt) markets in the world. Jeffrey Christian had just told the chairman of that commission, another ex-Goldman Sachs banker, Gary Gensler, that the Big Banks had drowned the gold and silver markets in paper, a move which prevented (necessary) price discovery.


What did the CFTC do after being presented with this proof of futures trading corruption in the gold and silver markets? It did nothing. Well, technically, it “probed” the silver market for five years (or so it claimed). And after studying the most corrupt market in the history of human commerce for five years, it proclaimed that it had found nothing. Absolute corruption.


Note the effect of such futures trading as confirmed by these banking insiders themselves. Futures trading operates to effectively create a gigantic, artificial supply of a commodity – a fraudulent supply. This is the bankers’ world of paper-called-gold and paper-called-silver, where investors entering the marketplace are told that they are being sold “silver” or “gold” when all they have actually purchased is a (worthless) piece of banker-paper.


This brings us to another primary tool of fraud used constantly by the banking crime syndicate: short selling. Again, it’s necessary to define this term. “Short selling” is, literally, selling something that the seller does not own.


As with the banking fraud known as “fractional-reserve banking,” short selling is prima facie fraud, meaning that it is fraudulent on its very surface. As with fractional-reserve banking, short selling is illegal for any individual or entity outside of the structures of the banksters’ pretend-markets.


As with futures trading, short selling creates an artificial supply of a commodity, another fraudulent supply. To create a veneer of legitimacy for this fraud, short sellers are supposed to “borrow” what they sell onto the market, effectively selling something that they (at least) possess, even though they don’t own it.


Despicably, this is not what usually happens. Instead, we see the systemic crime known as naked shorting, when short sellers do not borrow what they are selling but instead perpetrate naked fraud – thus the term “naked shorting.” As with all other systemic financial crime perpetrated by the One Bank, our pretend-regulators and pretend–justice officials simply ignore this blatantly illegal activity.


Why would our governments have allowed the introduction of short selling, let alone the illegal devolution of naked shorting? Once again, we can thank the bankers. And, once again, we see more of their Machiavellian inclinations.


“Give us short selling,” they hissed, “and we’ll give you better price discovery.” In fact, the silver market perennially reports the greatest amount of shorting in any commodity market (in proportionate terms), and yet – as we have seen – the result is no price discovery, ever.


Notice how both futures trading and shorting are tools of financial crime with an obvious downward bias in terms of their principal effectiveness. Create an artificial increase in the supply of anything, and you automatically put downward pressure on the price of that commodity.


This pattern would be obvious to any child competent in arithmetic. Yet what do we see in silver? We see thirty years of consecutive supply deficits and zero price discovery. We see proof of systemic crime.


We also see two tools of obvious financial fraud placed into the hands of the banking crime syndicate. Those tools have an obvious/systemic price-suppression bias, and we see them being used more – and often illegally – in the silver market than in any other market, year after year.


previous commentary pegged today’s “fair price” for silver at $1,000 (USD). At this moment, we see the price of silver below $14/oz (USD). After three decades of this comically obvious fraud, perpetrated by a single crime syndicate, what do the officials in our governments and regulatory institutions tell us? It’s just business as usual.


Please email with any questions about this article or precious metals HERE


Thirty Years of Zero Price Discovery in Silver 

Written for Sprott Money by Jeff Nielson (CLICK FOR ORIGINAL)


Jeff Nielson is co-founder and managing partner of Bullion Bulls Canada; a website which provides precious metals commentary, economic analysis, and mining information to readers/investors. Jeff originally came to the precious metals sector as an investor around the middle of last decade, but soon decided this was where he wanted to make the focus of his career. His website is www.bullionbullscanada.com.

Thursday, December 17, 2015

$50 Silver? 256% Rise in Silver Prices Not as Crazy as You Might Think

Published here: http://www.profitconfidential.com/silver/50-silver-256-rise-in-silver-prices-not-as-crazy-as-you-might-think/

Silver Prices to Skyrocket in 2016? It’s Possible
Silver prices remain low, but don’t be shocked if they move to the upside in 2016.

As it stands, there’s too much noise regarding precious metals being bad investments. One of the biggest reasons behind this narrative is that the Federal Reserve will continue to raise rates. We are told on a regular basis that when interest rates rise, you don’t need precious metals.

However, when I am looking at silver, I try to ignore the noise and pay attention to the price action. It reveals a lot about.

The post $50 Silver? 256% Rise in Silver Prices Not as Crazy as You Might Think appeared first on Profit Confidential.

Federal Reserve Rate Hike At ‘Precisely The Wrong Time’ – Faber

Published here: http://www.zerohedge.com/news/2015-12-17/federal-reserve-rate-hike-%E2%80%98precisely-wrong-time%E2%80%99-%E2%80%93-faber

Federal Reserve Rate Hike At ‘Precisely The Wrong Time’ – Faber

Marc Faber, the editor of the Gloom, Boom & Doom Report, warned yesterday that the Federal Reserve has raised rates at “precisely the wrong time.”

Gold_Faber

Speaking to CNBC just before the interest rate decision, Faber warned that it’s the wrong time because “the global economy has decelerated very badly, and many countries are already in recession, or going into recession.”

The rate hike separated the Fed from other major central banks – The ECB, Bank of England, PBOC, the Bank of Tokyo and elsewhere that are all battling deflation and desperately trying to stimulate some form of sustainable economic growth.

Yesterday’s hike still leaves U.S. monetary policy extremely loose, and Fed officials have signaled they will act cautiously from to nurture a very tenuous recovery indeed.

Faber said the outlook for American equities looks weak:
“I don’t think U.S. stocks are attractive by any measurement. They are expensive and earnings are going down, and if anything, eventually interest rates will be higher.”

Marc Faber is a strong advocate of owning physical gold and silver which he describes as being a way to become “your own central bank.” He believes an allocation and diversification into physical bullion will serve as vital financial insurance and that storing gold in Singapore is prudent as Singapore is the safest place to own bullion in the world today.

Video can be watched on CNBC here
Marc Faber Webinar on Storing Gold in Singapore 
Download Essential Guide To Storing Gold In Singapore


BREAKING GOLD NEWS and COMMENTARY TODAY – CLICK HERE


DAILY PRICES
Today’s LBMA Gold Prices: USD 1065.85, EUR 982.71 and GBP 713.06 per ounce.
Yesterday’s LBMA Gold Prices: USD 1065.75, EUR 975.65 and GBP 710.33  per ounce.


Gold Bars At 2% Premium and Free Storage For Six Months On Orders Before December 31st
  • 2016 looks set to be stormy – arguably it has never been a better time to buy gold
  • Gold bars (1 oz, LBMA) at just 2% on orders placed prior to December 31st
  • One of lowest premiums in market today for one ounce bullion coins and bars
  • Currently sell gold bars (1 oz) at 3.75% so this is nearly 50% reduction in premium
  • Free storage for six months – allocated and segregated storage of your bars in safest vaults in world
    * This is a phone offer only
    ** A minimum order of 5 gold bars applies
    *** Gold coins and bars are tax free – no stamp duty, VAT or sales tax

    Call Us Today To Secure Your Allocation

  • IRL +353 (0)1 632  5010
  • UK +44 (0)203 086 9200
  • US +1 (302) 635 1160

Gold & Silver or Meth & Madness

Published here: http://goldsilverworlds.com/gold-silver-experts/gold-silver-or-meth-madness/

“Meth” or Methamphetamine is a common recreational drug used, according to Wikipedia, to induce feelings of euphoria, increase sexual desire, and stimulate weight loss, among others.

QE or Quantitative Easing, injecting liquidity, bond monetization, and “printing money” are common Keynesian economic prescriptions used to inflate economies, enable deficit spending and boost financial profits, among others. Some call it monetary madness.

There are many disturbing similarities and it is clear that excessive use of both Meth and QE are destructive.

Your brain on drugs, your economy on QE:

In low doses Meth can elevate mood and increase alertness and energy. The FDA has approved a variation of Meth for attention deficit disorder and obesity in adults and children. But Meth is heavily used for “recreational” purposes and is both addictive and highly profitable for the producers, whether legal or illegal.

“Printing money” in modest quantities appears to stimulate economic activity and creates the illusion of enhanced wealth. In the late 1990s people were obsessed with stock prices, CNBC, the “money honey,” the latest dot-com IPO, and spending money like the cash supply would never cease. Subjectively speaking, it felt like a drug induced “high” that we hoped would last forever.

In higher doses, Meth can produce psychosis, cerebral hemorrhage, mood swings, delusions and violence. Meth addicts will do increasingly bizarre and violent things to obtain their addictive drug.

“Printing money” in large quantities, such as in Japan and the EU currently or the Fed’s $85 Billion per month of QE initially creates the delusion that the central bank is all-powerful, and that policies which have failed in the past will somehow produce wealth and economic benefits this time. Fundamentals, such as supply and demand, seem less important in analysis of stocks, bonds, and commodities, and central bank policy becomes overwhelmingly important. Financial leverage and risk increase, flash crashes occur, volatility soars, and everyone is obsessed with the latest Fed statement.

The final stages of Meth addiction can produce violence, paranoia, cerebral hemorrhage, and delusional behavior. The crash after the euphoric stage can last months, the addict craves the drug, and increasingly risky behavior makes death from overdose, systemic failure, or physical violence more likely.

The final stages of “money printing” addiction can create a currency crisis, massive defaults, deflationary collapse, hyperinflationary price increases, and delusional beliefs such as “it can’t happen here” and “the Fed will fix it.” The crash after the inflationary euphoria can last years or decades, and economic collapse and systemic failure are much more likely.

As I write, the world awaits the 16 December pronouncement from the Fed. (Will she or won’t she – she did!) As I write, Meth addicts around the world wait for their next fix, worry their supplier might raise the price of their drug, or worse, they need to find a new dealer.

CHOICES: Cooking meth or cooking the books? Drugs or QE? Delusions and violence or all-powerful central banks? Drug induced temporary euphoria or the madness of paper currencies and intentional inflation?

Say NO to drugs. Say NO to QE, debt based fiat paper currencies, and central banks.

Okay, I admit, we all know that QE, fiat paper currencies, and central banks aren’t going away, so we should protect our purchasing power with physical gold and silver, preferably securely stored outside the banking system.

For projected silver prices in five years, read my book: “Who Killed Doctor Silver Cartwheel?” – available at Amazon.

Gary Christenson
The Deviant Investor

Economic Disaster

Published here: http://www.zerohedge.com/news/2015-12-16/economic-disaster


Hold your real assets outside of the banking system in a private international facility  -->  http://www.321gold.com/info/053015_sprott.html 


Economic Disaster

Posted with permission and written by Rory Hall of The Daily Coin (CLICK FOR ORIGINAL)


If we look at some of the dots that are beginning to line up, 2016 may not be a very good year for manufacturing, retail or the economy as a whole. The U.S. economy is 70% retail, which is an unsustainable economic base anyway you look at it. If the people that flip burgers next door to the big box store are one-anothers-customers and this is the majority of your economic base, how is that sustainable?

Caterpillar, which has been one of the “measuring sticks” for China’s growth, the mining industry and construction around the world, is in trouble. As the world’s largest manufacturer of heavy construction equipment one can get a sense of what will be happening in the coming months based on the sales of Caterpillar equipment. No sales, no construction and from there you have a massive whole in the economy. The number of other industries that are tied to construction and mining are immense. The situation is so bad Caterpillar announced they were cutting 10,000 jobs through 2018 and 5,000 of those would be in 2016. This does not bode well for global economic growth.

As we have reported for most of 2015 the Baltic Dry Index (BDI) has been bleeding-out all year. In the Spring the BDI was already falling off a cliff and people were crying that it was due to the Longshoreman’s strike in California that began in February 2015. This was simply not the case as the BDI has continued to slide and on two different occasions hit new record lows. The BDI represents the contact price for container ships that haul raw materials to China, India and the other manufacturing centers around the world, including the U.S. As these numbers tumble, this means no one needs this service. From my perspective, if manufacturing centers are not receiving raw materials there must be a slow down in manufacturing. This is one of the first steps in creating an economy. There must be products made in order for stores to have products on the shelves. No products, no business, no economy. You can see a plethora of articles, from a variety of sources, on this topic HERE. It is stunning how this index has tanked and doesn’t appear there will be a recovery anytime soon.

So far, nothing being built, no resources being extracted from the earth to create steel, cooper and the other materials to build homes, businesses and other structures. The shipping component of the raw materials has been in free fall for almost a year and the Federal Reserve, the Bureau of Labor Statistics and the other government agencies would have everyone believe all is well and the recovery is going great!! What a freakin’ lie.

Another component that shows 2016 could be in for a very rough ride is the Shanghai Containerized Freight Index (SCFI). Wolf Richter has done a marvelous job of brining this index to light. Mr. Richter has written extensively about this index and has painted a picture that is as bleak as the previous two indicators. The SCFI is, basically, the third leg in the manufacturing cycle. Raw materials have been dug out of the ground (Caterpillar), shipped to the manufacturing centers (BDI) and made into a finished product to sell and the SCFI show us how much of the finished product is making it’s way to market. Needless to say, this too, has dropped like a stone for most of 2015. Once again, there is a plethora of articles from multiple sources on this topic HERE.

This is what Mr. Richter reported in October 2015. You would think that retailers, in the U.S. anyway, would be preparing for the “spending season” that begins in earnest in late November. That is not the case according to these numbers:

The latest weekly reading dropped another 1.7% from the prior week to 752.21, the worst level ever. The CCFI is now 30% below where it had been in February this year and 25% below where it had been 17 years ago at its inception. 


The Shanghai Containerized Freight Index (SCFI), also operated by the Shanghai Shipping Exchange, tracks spot rates (not contractual rates) of shipping containers from Shanghai to 15 major destinations around the world. It’s even more volatile than the CCFI. But being based on spot rates, it’s a good indicator where the CCFI is headed. 

For last week, the SCFI plunged 5.4% to a new record low of 537.73, down 46% from where it had been at its inception in 2009 when it was set at 1,000 – and down 52% from February:


Not that any of this matters for stocks. What matters are central banks. And they have once again spoken. They’re frazzled by these signs of “unexpected” deterioration. Even China’s official GDP growth rate, at 6.9%, inflated as it may be, is now down to the worst level since the Financial Crisis.


That leaves the “end user”, the retail market. What’s happening there? According to latest Bureau of Labor Statistics report the U.S. piled on 211,000 new jobs!! WoooHoooo we’re saved!!! Well, if you take a look at the reality of what these numbers actually represent you find some startling revelations. Like, over 300,000 part time jobs. You find a labor participation rate continuing to drop. Labor participation is the number of people of working age – 16-54 age group – and that number has fallen throughout 2015. It is now somewhere around the mid 1970’s level of participation. Has the population of the U.S. increased since the mid 1970’s? Well, why aren’t these people working? Why do they not have a job? How can an economy experience a “recovery” in 2015 when it continually loses it’s workforce?

What about retail sales? Is anyone selling products that aren’t being manufactured or shipped? Apparently not.

According to Dave Kranzler, Investment Research Dynamics, the biggest sales day of the year, Black Friday, fell by 10% year over year:

Total sales in the US on Black Friday fell 10% to $10.4bn this year, down from $11.6bn in 2014, according to research firm ShopperTrak. – The Guardian 
Store-based sales dropped $1.2 billion, while online sales increased $150 million. The media is going to highlight the increase in online sales. But remember, online sales represent only 6% of total retail sales. The plunge in brick-and-mortar sales was nearly 10x greater in total dollars than was the increase in cyber sales.


Mr. Kranzler is not alone his analysis. ZeroHedge also discussed the year over year decline:

We can hear the mainstream media now – “Great News Everyone!! The American consumer is back” – online sales on Black Friday rose 10% to $1.7 billion which ComScore says shows “strong spending.” The only problem is – which we suspect will be oddly missing from the mainstream narrative, as ShopperTrak reports total sales on Black Friday crashed 10% to $10.4 billion. While blame has been placed on early opening on Thanksgiving, that is false too since spending on that day also plunged 10%. So, the sales news is unequivocally bad – which is hardly surprising given the collapse in consumer confidence. 
So to clarify… (via The Guardian) 


Total sales in the US on Black Friday fell 10% to $10.4bn this year, down from $11.6bn in 2014, according to research firm ShopperTrak. 
The decline in sales on the traditional busiest shopping day of the year has been blamed on shops opening the day before. But this year, sales on Thanksgiving also dropped, and by the same percentage, to $1.8bn. 
So, for those with difficulty with reading and math… 


If you add all this together it can mean only one thing: the Federal Reserve knows exactly how to steer an economy and have done a helluva job since the 2008 financial crisis began! Quantative Easing (QE) and Zero Interest Rate Policy (ZIRP) have worked like a charm! The “recovery” is in full swing; with full employment, according the Bureau of Labor Statistics a mere 5.0% are unemployed. The Dow Jones Industrial Average is in great shape and the people are spending, spending, spending!! What a joyous time.

Now, slave, get back to work, if you have a job, and make sure you save some energy for your other part time employment as you will be going to those jobs later today. Full employment as defined by the Federal Reserve is two or more part time jobs for everyone. Generating enough income to pay taxes, insurance and maybe a mortgage/rent.


Please email with any questions about this article or precious metals HERE


Economic Disaster

Posted with permission and written by Rory Hall of The Daily Coin (CLICK FOR ORIGINAL)


Rory Hall, Editor-in-Chief of The Daily Coin, has written over 700 articles and produced more than 200 videos about the precious metals market, economic and monetary policies as well as geopolitical events since 1987. His articles have been published by Zerohedge, SHTFPlan, Sprott Money, GoldSilver and Silver Doctors, SGTReport, just to name a few. Rory has contributed daily to SGTReport since 2012. He has interviewed experts such as Dr. Paul Craig Roberts, Dr. Marc Faber, Eric Sprott, Gerald Celente and Peter Schiff, to name but a few. Visit The Daily Coin website and The Daily Coin YouTube channels to enjoy original and some of the best economic, precious metals, geopolitical and preparedness news from around the world.

Tuesday, December 15, 2015

Gold And Silver – Problem, Reaction, Solution Does Not Apply To PMs.

Published here: http://goldsilverworlds.com/gold-silver-experts/gold-and-silver-problem-reaction-solution-does-not-apply-to-pms/

The Rothschild-now-globalist template for gaining control over all money, and now the world, has been create a Problem, let an adverse Reaction develop, then present the desired Solution.  On a grander scale, there was the US Civil War to divide the country,
then the manufactured Roaring ’20s and the stock market bubble, burst when the money changers purposefully tightened the money supply creating massive margin calls and the Crash of 1929.

On a more recent level, we commented on the Arab refugee situation designed to weaken Europe, [See article], as a plan to further the New World Order.  The globalists created a Problem in the Middle East.  This created an [orchestrated] Reaction of fleeing  Arabs to escape the US-driven destruction in their countries, most recently in Syria.  The most recent offered Solution?  Eliminate borders between European nations and institute EU- controlled border guards, whether any country wants them or not.  Checkmate, Europe. Let the globalists take control over your borders.

Precious Metals, [PMs], have been exempt from that template.  Instead, the Problem has been singular:  keep a stranglehold on the price of gold.  It does not matter what the Reaction is, the Solution is to keep the Problem in place: the removal of PMs as a competitor to the globalist’s fiat money Ponzi scheme.

Look at the Fed’s fiat [make believe] “dollar,” nothing more than an instrument of debt, and we all know, or should know that debt cannot be money. The globalists have won that mind game as the world believes a fiat Federal Reserve Note is actually a real dollar.  It is not, never was, and never can be, yet the Ponzi scheme thrives, nearing its point of self- destruction.

While there was a sizable correction in the fiat “dollar,” recently, a look at a monthly chart shows the Ponzi game is far from over.  Is a top in? Not likely, from our perspective.  This could be the beginning of some topping activity, but tops take time to form and complete.  The “dollar” game will not be over until the globalists are ready to pull the “dollar” plug and replace it with their next Ponzi scheme, paper Special Drawing Rights, [SDRs], to include China’s blessings and participation, and Russia is also behind that scheme.

The game of bait-and-switch from West to East has been planned and in process for decades.  For as long as the scheme goes on, gold and silver will remain in the doldrums.

The globalists will have it no other way.

DX M 12 Dec 15

Why has not gold and silver responded to the reality of overwhelming demand for physical gold from China, India, Russia by the tons, and unparalleled public participation by the ounces?  We include a chart on crude oil to help provide an answer.  When a decision has been made to control a market, the reality of the natural laws of Supply and Demand are thrown out the window and are of no consequence, to the consternation of most.

Precious metal stackers are intimately familiar with this constant decline in price while demand soars.  Oil has been the latest misuse of power as the Saudis are out to destroy as much competition for its market share in oil as possible.  Where $70-$80 a barrel was thought to be important support, it was not even a temporary stopping point in the unabated slide from $100 down to $40, and now in the $30+ range.

The two horizontal lines show potential supports for crude oil, price just a few dollars away from the last major bottom in 2008.  The $25 area would be next should $30+ fail.  Does supply and demand matter to the Saudis [?], and we doubt they are acting independently from the globalists who plan for everything that takes place in their Problem-Reaction-Solution scheme for a one world currency, the SDR, [not gold-backed, by the way] and a one world government, enslaving people all over the globe.

CL M 12 Dec 15

The following comments may not be what one wants to hear, but charts tell what the reality is behind any market, and we are just the messenger delivering the chart-driven message.  It is one we have been saying for the last 4 to 5 years, with regard to not being on the long side in the paper futures market.  The simple but valuable premise is: never buck the trend.  Being long physical metals is a different story for very valid different reasons.

Can, will gold see glory days ahead?  This is a question not asked by many, now, and even fewer just a few years ago when gold was almost universally expected to surpass $10,000 per oz, at least within the PMs community.  The monthly chart is not a pillar of strength as price continues to recede lower and lower with no meaningful rally attempts that would reflect the reality of actual physical demand.

Had gold stayed above $1,500, the chart pattern for continuing higher would have remained a robust potential.  Just like crude oil is being driven to price levels almost no one thought possible, that has been the story for gold and silver for the past five years with no end in sight, currently.

The higher controlling pattern in the monthly chart shows no sign of an impending turnaround in the price of gold.  However deflationary [to one’s mind] this may sound to gold and silver enthusiasts, and we are among them, the alternative, fiat, now soon to be digital world currency, is even less appealing.  Time remains on the side of the globalists, for now.

GC M 12 Dec 15
The best read for price behavior moving forward is its overall past with an emphasis on its present developing market behavior, and that behavior does not show a break in pattern to the downside. So far, every encouraging rally has proven to be a blip in the overall malaise inflicted on gold and silver advocates by the moneychangers.

GC W 12 Dec 15

We keep looking for signs of a turnaround without seeing any.  Rallies have been weak. Note how far away a 50% retracement is on the chart.  Half-way retracements are used as a guide to gauge the character of a trend.  For as long as  a down trend can keep  rallies from extending past 50% of the last swing decline, the trend is in no danger of ending. When price cannot muster much beyond just a 25% reaction rally, the activity speaks for itself.

GC D 12 Dec 15

Silver has a slightly different structure to its down trend, but it remains entrenched in its trend lower.  The monthly shows no signs of encouragement that price has reached and/or is making a bottom.

SI M 12 Dec 15

When one continues to buy physical gold and silver, it is silver that will more than likely provide the best return on exchanged paper currency. The gold:silver ratio is now around 77 to 1.  Every ounce of gold has an equivalent value of 77 ounces of silver.  Ten oz of gold would yield around 720 oz of silver, accounting for transaction costs.

The historic ratio between gold and silver is said to be around 15:1, even 25:1.  Should the ratio return to say 35:1, for the sake of argument, the 10 oz of gold exchanged for 720 oz of silver can now be reversed.  The 720 oz of silver can be exchanged for just over 20 oz of gold, say 19, after transaction costs.  The previous holding of gold, 10 oz, has now become 19 oz without ever having been out of holding PMs.

Food for thought.

It may take years for the ratio to rebalance from 77:1 to lower, but so what?  One’s holdings are still going up in value for little to no risk.  A thoughtful silver lining in the chart cloud.

SI W 12 Dec 15

A week ago prior Friday’s strong volume rally was a short-covering event evidenced by the fact that the rally could not sustain itself.  The 15.10 area would be a 50% retracement, and the market has shown an inability to mount any kind of meaningful rally over the past few months, despite a few falsely encouraging rallies intervening.

The message is no different in the daily silver chart.  Much more evidence is needed before one can entertain any thoughts for a change in trend. The most positive aspect for silver is the fact that the gold:silver ratio now strongly favors buying/owning physical silver over gold.

Prices for both metals are cheap, and despite what some may construe as not so favorable an outlook for PMs, at present, which is exactly what the globalists want from people.  Get as many discouraged in their faith for buying/holding PMs as possible.  Create false fiat gods.  Destroy all beliefs that gold and silver will again be a storehouse for value.  Rinse and repeat.

Always remember, the globalists who want to instill that false paradigm are the same ones who are issuing trillions and trillions of worthless so-called money, and no regime, from the beginning of civilization, has ever escaped from the collapse of every Ponzi scheme, including the current one that has been extraordinarily stretched beyond imagination, let alone far beyond reality tolerance.

If you feel disheartened, it is three rotten cheers for the globalists.  If you want to take a stand against them, keep the faith.  Keep your precious metals.  The time for change has not yet come, but it will.  It is lunatics that are running the show.

“The paper holds their folded faces to the floor
And every day the paper boy brings more.”

SI D 12 Dec 15