
By the SRSrocco Report,
As the U.S. Stock Market Bubble continues upward toward a giant pin, there are some interesting developments that precious metals investors will find quite interesting. Yes, there's still a lot of life left in the precious metals, even though pessimistic market sentiment has frustrated a lot of gold and silver investors.
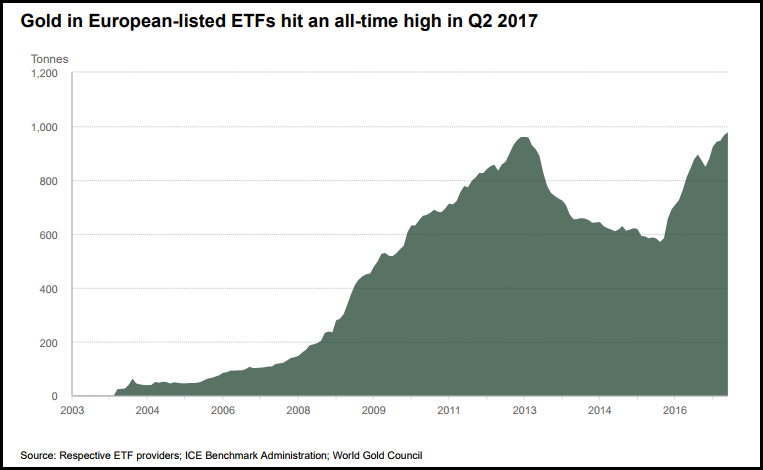
Also, even though precious metals investment demand in the U.S. has fallen 40+% compared to the same time last year, it continues to be strong in other parts of the world. For example, German physical gold bar and coin demand increased 8% in the first half of 2017 versus the same period last year, while U.S. fell by 45%. Moreover, flows into European Gold ETF's hit a record during the second quarter of 2017:
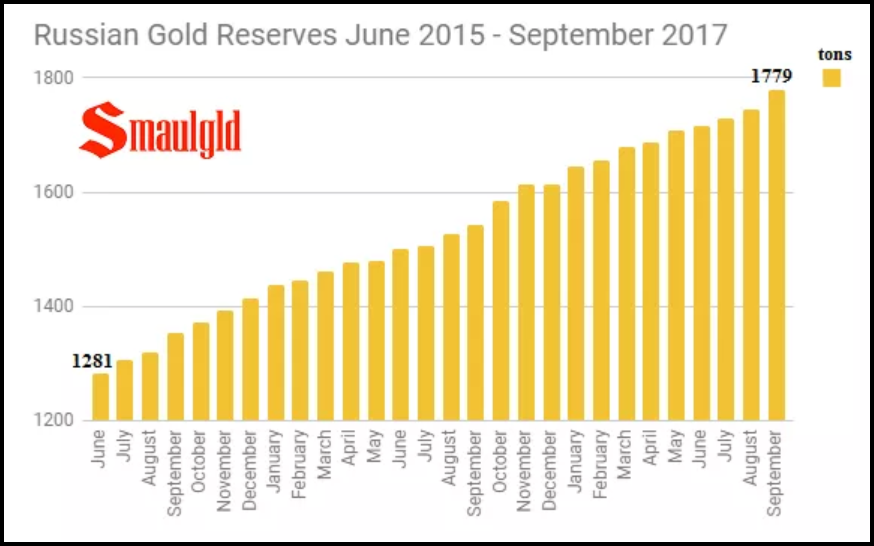
Now, if we look at what is going on with gold and Central Bank demand, Russia takes the first place. According to the article by Smaulgld, Russia Steps Up Gold Purchase With Massive Buy In September:
In September 2017, the Central Bank of Russia added 1.1 million ounces (34.2138 tons) of gold to her reserves, raising her total to 1779.119 tons or 57.2 million ounces.
Central Bank of Russia has added 5.3 Million ounces (approximately 165 tonnes) in 2017 through September.
If you haven't already checked out Louis's work at Smaulgld.com, I highly recommend you do. So, as the German public and Russian Central bank continue to increase their gold holdings, Americans have cut back considerably, or worse... have been liquidating. Furthermore, the U.S. gold market is suffering another supply deficit this year. As of July 2017, U.S. gold mine supply and imports totaled 288 metric tons (mt) while exports were 290 mt. Thus, we have exported ALL of our gold mine supply and imports overseas. (NOTE: 1 Metric Ton = 32,150 troy oz.)
You see, the Federal Reserve and Wall Street have done a marvelous job in totally lobotomizing the American public in regards to gold as money. American citizens have no idea that the printing cost of $1,300 worth of $100 bills (13) costs $1.95, whereas one ounce of gold valued at $1,300 production cost is $1,150-$1,200. The U.S. Dollar was backed by gold up until 1971 but is now backed by the $20+ trillion in debt.
Surge In U.S. Debt Props Up Stock Market
As I mentioned in a previous article, it was uncanny how the ONE-DAY $318 billion increase in the U.S. debt on Sept 8th marked the peak in the precious metals prices while the Dow Jones Index bottomed. The next two charts show how an increase in debt impacted REAL MONEY negatively while it pushed the DOW JONES further into bubble territory:
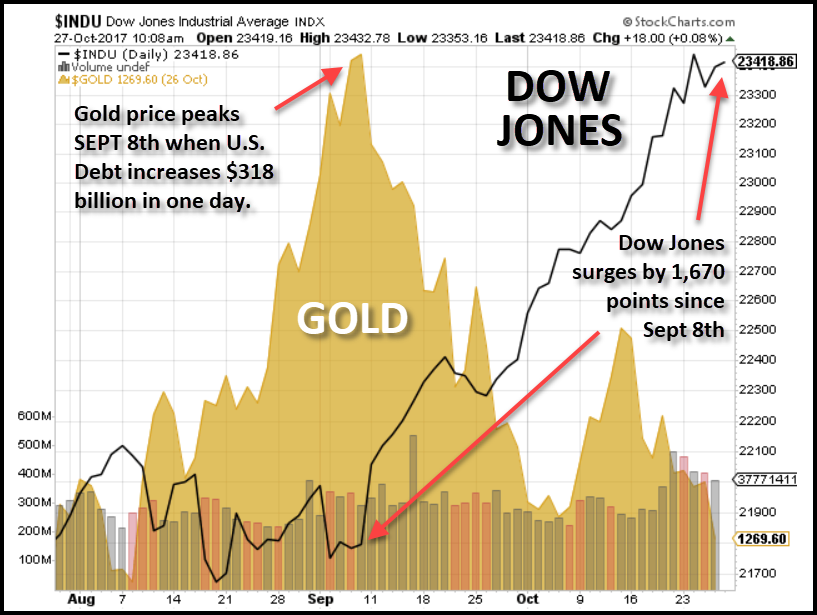
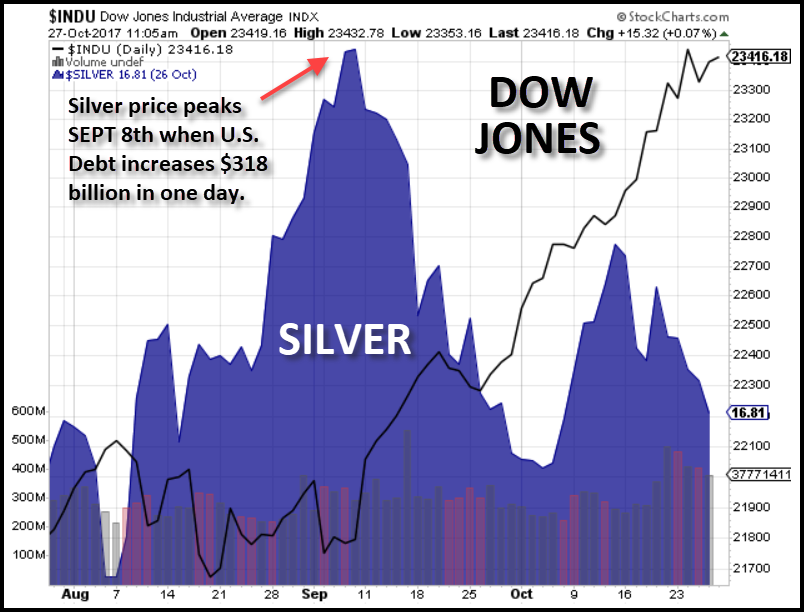
You will notice in the GOLD chart that the Dow Jones Index remained flat right up until Sept 8th. Since Sept 8th, the Dow Jones Index increased 1,670 points (+8%) while gold fell $85 (-6%) and silver declined $1.30 (-7%). I get a laugh at the news how the U.S. hit an astonishing 3% GDP in the third quarter. It's amazing what debt can do to prop up markets and GDP.
So, how much has the U.S. Debt increased since Sept 8th? According to the figures at the TreasuryDirect.gov, a bunch:

In just seven weeks the wizards at the U.S. Treasury increased the total government debt by a whopping $600 billion (actually $595 billion to be exact). Again, amazing things can be done to the economy when you pump $600 billion into the market. Who the hell knows where this money goes, but I can guarantee that it continues to allow Americans to buy cars, homes and the millions of products and gadgets we most certainly can't live without.
UPDATE: The folks at TreasuryDirect.gov just updated the total public debt for Oct. 26th. I thought you would like to know they added another $14 billion yesterday, to $20,453 billion up from $20,439 billion on Oct 25th:

So, another $14 billion to make sure everything continues to run smoothly... or they hope and pray.
U.S. Interest Expense On Its Debt Hits Record In 2017
The downside to printing money and increasing debt is the little annoying problem called rising INTEREST PAYMENTS. Even though the Fed has been successful in lowering the interest rate, the U.S. Government paid the largest amount of interest expense ever this year. In fiscal 2017, the U.S. Treasury forked out $458 billion worth of the American's hard earned money just to cover its interest expense:
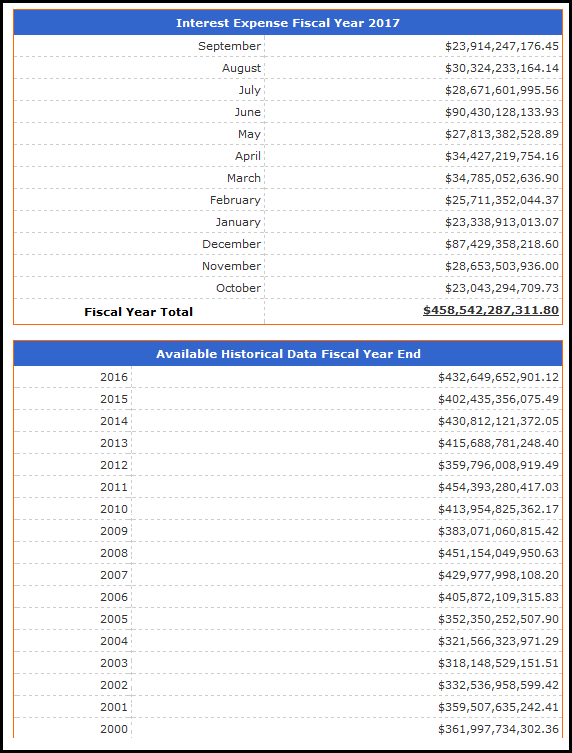
If we look at the historical data on the annual interest payments, this year's $458 billion was not much higher than the $454 billion in 2011. The reason for that was the average interest rate on our debt in 2011 was 3.1% versus the 2.3% for fiscal 2017. Thus, a falling interest rate on rising debt levels keeps the interest payment from surging higher.
For example, in 1988, the interest expense was $214 billion on total public debt of $2.6 trillion. However, the average interest rate on our interest expense was much higher at 8.2% in 1988. Can you imagine what the interest expense would be today at an 8.2% rate? It comes out to be a cool $1.67 trillion. Well, that just couldn't fly, could it? If the U.S. Treasury had to pay $1.67 trillion to service its debt today, it would go belly up.
Now, there's a good reason I selected 1988 interest rate and expense as an example. It has to do with the next section and the 1987 market crash.
U.S. Stocks Setting Up For Another 1987 Market Enema All Over Again
Investors who have been around for a while, certainly remember the 1987 market crash. In just one day, the Dow Jones Index lost 25% of its value. I bring this up because there seem to be some striking similarities between the market today and the time leading up to "Black Monday," in 1987.
According to the Zerohedge article," The Nightmare Scenario" Revisited: Albert Edwards Lays Out The Next Black Monday:
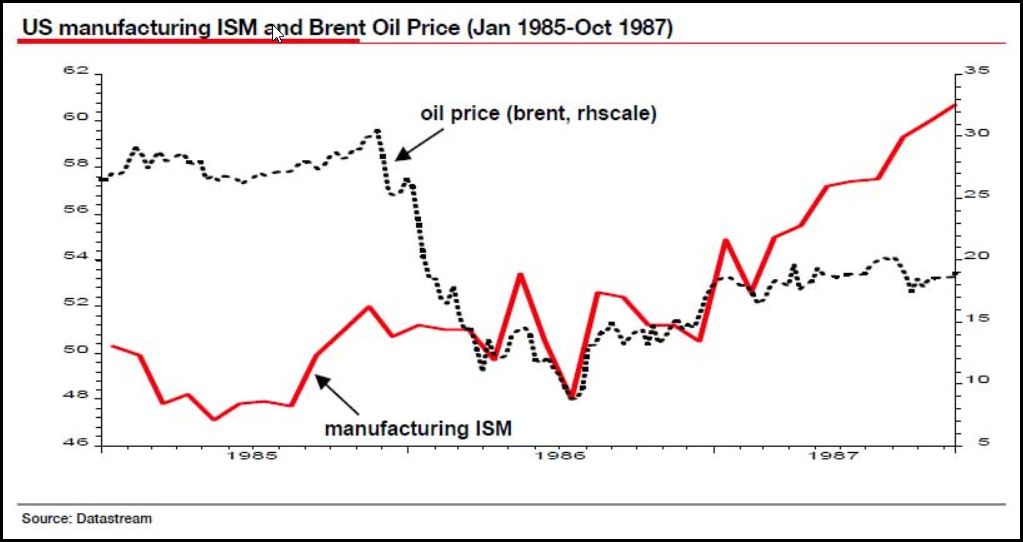
A retrospective macro-narrative was inevitably wrapped around the "Black Monday" 19 October 1987 equity market crash. My 30-year recollection is pretty good: 1987 saw a buoyant equity market rising briskly through most of the year as the oil price recovered from the previous year's collapse (from $30 to $8, see chart below). After a year in the doldrums the US economy started to accelerate notably through 1987 as the impact of 1986 interest rate cuts and a lower dollar worked. By the time of the Oct crash the US ISM had surged from 50 at the start of the year to over 60 - a level seldom ever reached (see chart below). Amazingly the ISM has just last month exceeded 60.0 for only the second time since 1987. Spooky!
I am clear in my mind both at the time and now, that the US equity market was priced for a continuation of rapid economic and profit growth and this was under threat. The Dow was on nose-bleed valuations, especially as it had ignored the bond sell-off for most of 1997 (was it really 30 years ago that US 10y yields briefly crawled back above 10% - the last time we would see double-digit yields). None of this would have mattered if the US equity market had been cheap. In my view the record 25% ‘Black Monday’ October 19 decline was due to a horrendously expensive equity market suddenly confronted with the fear of recession. Equity valuations matter.
To summarize Albert Edwards, he shows that the rebound in the oil price allowed the markets to recover in '86 and '87 as manufacturing (ISM) improved significantly. Furthermore, he says the ISM manufacturing number last month has exceeded the 60.0 mark, only for the second time since 1987.
Edwards concludes by saying the 1987 "Black Monday" crash would not have taken place if equity valuations were "cheap." Unfortunately, for the investors today, the valuation of the Dow Jones Index is most definitely in NOSE-BLEED territory (and then some), as Edwards suggests.
While mainstream investors and many frustrated precious metals holders have totally dismissed fundamental valuations, all bubbles come to an end. However, it seems to many; this one will go on forever. It won't.
Again, we can't forget about the $600 billion worth of U.S. Treasury Green Juice that was pumped into the market over the past seven weeks. To put that $600 billion into perspective, look at the following:
What $600 billion would buy:
2.0 million new homes worth $300,000 (New home sales Sept 2017, annualized = 677,000 units)
17.9 million new vehicles worth $33,560 (Total U.S. vehicle sales 2016 = 17.5 million)
15,000 metric tons of gold or five years of global mine supply (482 million oz)
The $600 billion pumped into the market over the past seven weeks would have purchased two million new homes or three years at the annual rate of 677,000 units. Furthermore, it would have purchased 17.9 million vehicles, more than the 17.5 million sold in 2016. Lastly, it would have purchased 15,000 metric tons (482 million oz) of gold.
Just think about that for a minute. The $600 billion of U.S. Treasury Green Juice would have purchased a year's worth U.S. citizens' vehicle purchases and three years worth of new homes. That's one hell of a lot of propping.... AND IN LESS THAN TWO MONTHS... LOL.
When the stock market finally does a nose-dive as its nose-bleed valuations finally succumb to investor FEAR, the price of gold and silver will head in the opposite direction, and violently. Yes, I realize it has been a bit of a long haul and a lot of frustration, but it will be worth it.
Lastly, if you haven't checked out our new PRECIOUS METALS INVESTING section or our new LOWEST COST PRECIOUS METALS STORAGE page, I highly recommend you do.
Check back for new articles and updates at the SRSrocco Report.


0 comments:
Post a Comment