A meme we have seen in the bitcoin community seems to be gaining traction. Bitcoin is deflationary. That is prices of things, measured in bitcoin, are falling. For example, in spring 2011, gasoline was ?1.00. This week, that same gallon had fallen to ?0.0001875. Gas has gone down by 99.98 percent!
We don’t think that even the diehard bitcoin bugs really believe this.
But it leads to an interesting point. In the past, we have used the analogy of measuring a steel meter stick with stretchy rubber bands. This analogy illustrates that you cannot use something which has a variable length to measure something of constant length. We have also used the analogy of a sinking boat tossing about in the waves of as storm, where people are asking “why is the lighthouse going up and down, but mostly up?” This picture helps visualize the fallacy of using the wrong perspective, the wrong vantage point, the wrong frame of reference.
We need a proper frame of reference for economic values. And now bitcoiners are (mostly jokingly) arguing that bitcoin is the correct frame. In the bitcoin frame, we are experiencing extreme deflation. Since 2011, bitcoin-CPI is -99.98.
Of course, the bitcoin bugs don’t mention the balance sheet implications of this. Suppose a business is doing perfectly fine, except that it uses bitcoin as its unit of account—called numeraire. It made an initial investment of $1,000,000 in 2011 in factory, inventory, etc. As this businesses keeps its books in bitcoin it records this as ?1,000,000 (assuming bitcoin was $1 at the time of the investment).
But by Dec 2017, bitcoin has gone up so much in dollar terms. That means that the dollar and the factory and inventory have gone down so much in bitcoin terms. Assuming no gain or loss in the investment in reality, in bitcoin terms it is now down to ?62.5. This looks like near total loss! It’s not a real loss, of course, just the distortion that comes from a bad choice of numeraire.
And suppose the company had borrowed ?500,000 for 10 years. The loan is still in force, and the monthly payment is still ?6,000. The cost to service this loan has gone up, from $6,000 to $96,000,000. There is no way to keep paying on that loan, so the business goes bankrupt. This is a real loss, which comes from a bad choice of currency to borrow.
The point of this reductio ad absurdum is to illustrate that whatever the right numeraire may be, bitcoin is not it.
Most people—even the gold bugs—argue that it’s the dollar which is the correct frame of reference. Whenever they say “gold went up $10 today” (or down), they are reinforcing the premise that the dollar is the numeraire. In this view, the dollar is the steel meter stick, against which the gold rubber band can be measured.
We have often poked a bit of fun at this, contrasting when they say, “the Fed is printing to infinity, the dollar is gonna collapse” with their promotion of gold as a way to profit—i.e. make more dollars. The very ones that will be worthless very soon.
But there is a serious point here. As a measure of economic value, the dollar is nowhere near as bad as bitcoin. It is unsuitable, though it distorts the picture less than bitcoin does.
Many of my colleagues in the Austrian School would say value is subjective, but, we have just come to the most objective, hard-edged, black-and-white issue of business and economics. It is the line between creating and destroying wealth. Businesses which create wealth should grow. Businesses which destroy should go out of business. If you get this backwards, your whole economy—your civilization—is doomed. It will cannibalize itself (this is a major theme of Keith’s Yield Purchasing Power work).
The dollar works perfectly fine to measure operating results. If you buy $32,000 worth of raw materials, and a month later sell finished goods for $48,000, that’s a not-terribly-inaccurate picture. If the dollar moved down a fraction of one percent that month, that hardly affects your profit and loss statement.
Where the dollar breaks down is on the balance sheet, in the outcomes of long-term calculation. If you bought a factory in 1977 for $1,000,000 and it’s worth $4,000,000 today, it appears to be a 400% gain. But is it?
Most people would argue that, well, that million was in 1977 dollars and you need to adjust the figure to 2017 dollars. And the way to adjust is to use inflation. In other words, consumer prices.
There are two flaws in this approach. One, consumer prices are measured in dollars. So using consumer prices to measure the dollar is somewhat circular
Two, consumer prices are not a good frame of reference. What goes into consumer prices? Of course the dollar is a factor. But hardly the only one (and we argue falling interest drives prices down, notwithstanding the rising quantity of dollars). What happens each time the government forces employers to pay a higher wage or more costly regulatory compliance? One thing is for sure: government has added a lot to the cost of production since 1977.
At the same time, businesses have found ways to produce the same goods using less labor and less capital. In other words, productive efficiency is greater today.
In the best case, the consumer price index measures: rising quantity of dollars – falling interest + rising government-imposed burdens – improved efficiency.
In other words, consumer prices represent a rubber band, a spring, a spreader screw, and a vice connected end to end. When the whole contraption gets longer, we just adjust the dollar down.
By analogy, consider a construction engineer trying to build a tall building in a fantasy world where the length of a meter stick shrinks as he climbs upward. On the ground, a meter stick is a meter. But on the 10th floor, a meter stick is only 75cm. And it’s a non-linear and unpredictable change. On the 11th floor, the meter stick shrinks to 60cm. And so on. One could just imagine on the 80th floor, he looks at the plans and tries to convert to “80th floor meters”!
We daresay that there would be no tall buildings in such a malevolent universe. As there can be no large enterprises in a malevolent economic universe, where it is impossible to measure wealth, and hence to tell the difference between creation and destruction.
Bitcoin, the dollar, and consumer goods do not work as the unit of measure. At this point, no one will be surprised that we say gold is ideal. Let’s look at why.
Revisiting the analogy of the engineer with the shrinking meter stick, we don’t ask “how long is a meter?” And we wouldn’t try to answer that by saying, “it is 1/3 of the height of the ceiling above the ground floor.” A meter is not measured in terms of things—things are measured in terms of meters.
This example shows the problem when the meter changes. The question is: changes relative to what? The only metric is: relative to the previous meter. One cannot build a building if each meter measures something different.
In economics, we can look at the value of a unit of a good and compare it to the value of the previous unit. We can look at marginal utility, and see how it changes with quantity.
If marginal utility is falling as quantity increases, then that means the economic value of the Nth+1 unit is less than the value of the Nth unit. Think about it. If you are dying of thirst, the 1st liter of water is worth anything you have. It is your life! The 2nd liter slakes the remainder of your thirst. The 3rd is a backup, to assure you can get out of the desert safely. The 4th is perhaps a backup. The 5th? Its value may be zero.
The marginal utility for all ordinary goods is falling, as quantity is rising.
A falling marginal utility means that the commodity is just like that shrinking meter stick. In other words, useless to measure the value of other things. Its own value is unstable.
This brings us to gold. There are two readily observable facts. One, virtually all of the gold mined over thousands of years is still in human hands. Two, gold mining is still active today. We are still adding more and more gold to a hoard that has been accumulating for millennia.
Looking at marginal utility, what does declining marginal utility tell you about the price as it relates to inventory stockpiles? The more inventories pile up, the more the price will drop. This is because each additional unit has lower utility, lower value. And price is set at the margin. The price of water is not set at $1,000 a liter because the first liter saves your life. It is set at pennies because the marginal unit is used to clean the sidewalk.
If the value of the Nth+1 unit is falling, then there is a limit to accumulation because if it falls below the cost of production then production will stop. Meanwhile, at lower prices new uses are opened up. So inventory accumulation causes falling prices, which causes reduced production and increased consumption. Stockpiles cannot go on accumulating year after year. Let alone for millennia.
Yet, this is exactly what has happened with gold.
Gold is very expensive to mine. Just watch what the guys on Gold Rush have to do. Gold miners only keep working, because the market keeps buying their product at a high enough price that production is profitable. Think about that. The price remains high, despite accumulating inventories for thousands of years. What does that mean?
It means that the marginal utility of gold isn’t falling.
It means that the value of the Nth+1 unit of gold is the same as the value of the Nth unit. It means gold is like a steel meter, which does not shrink as you climb to higher floors. It means the value of gold does not decline, as gold is added in a growing economy.
It means gold is the numeraire par excellence.
It means that if you measure economic values in gold, they are not distorted. What you see is what you get. Back to our 1977 factory example, the purchase price of $1,000,000 was 6,667 ounces of gold. Today its selling price of $4,000,000 is 3,200 ounces. You have in fact lost 52 percent. Oops.
By the way, if you use the consumer price index instead to adjust the dollar, then you see that $1,000,000 1977 dollars had the same purchasing power as about $4,000,000 today. Upon liquidation, your factory will buy just as much gasoline and apples and oranges and rent as it would have bought if liquidated in 1977. Hey, congratulations on that, at least.
In light of the above, we say that dollar speculators increased their bullish bets, especially Tuesday and Thursday. The dollar went up from 24.3 milligrams gold last week to 24.9mg by Friday’s close, or 1.9 grams to 1.96g silver. Or, if it’s easier to get your head around, the price of gold in dollars dropped $32 and the price of silver dropped $0.58.
We emphasize that it’s a rise in the dollar, not a fall in gold (silver fell slightly, about 0.0001oz gold per ounce of silver), because the dollar is the elastic rubber band and gold is the steel meter stick. Because the dollar has a central planner with a goal to devalue it by 2 percent per annum (measured in terms of the even-more-elastic rubber band of consumer prices). Because the dollar is well understood to be falling, and somewhat less well known to be slowly failing. In the sense described by Ernest Hemingway of “at first … slowly, then all at once.” (from The Sun Also Rises) So if the dollar is failing at first slowly, why would we use it to measure gold which is not failing?
This may also help people feel better about owning gold at times like this when the dollar rises. While most feel bad when they buy something that goes down, they usually don’t feel bad about not buying something that goes up. Well, today, if you own gold you do not own the dollar while it went up a bit. So? (and we expect that most readers have plenty of exposure to dollars, not just bank accounts but salaries, pensions, insurance, annuities, etc.)
We don’t just say this stuff as propaganda. Or to sell gold (we don’t sell gold). We say it because it’s the truth, and when you know the truth, and it’s an important truth, and it is not commonly understood, you want to get up on the rooftops and bellow the truth.
We hope we have not offended or bored anyone, and we promise to get to the fundamental charts and analysis below, and next week back to our regularly scheduled programming.
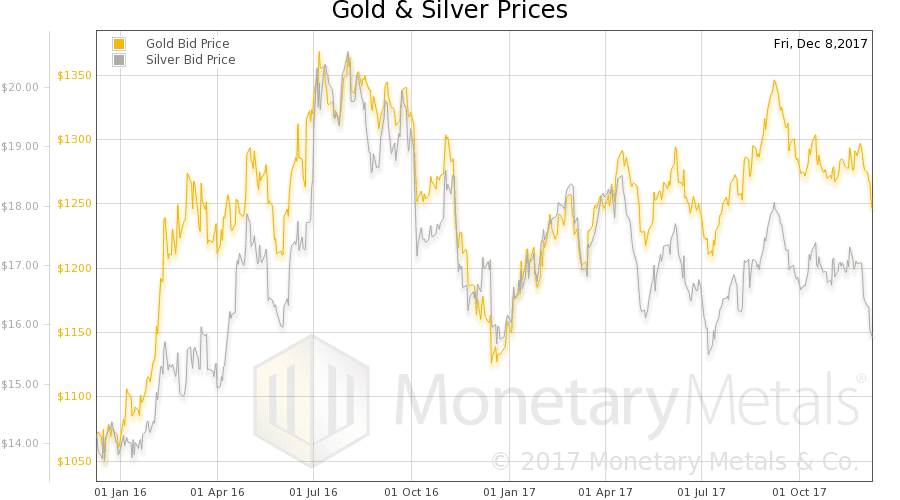
But first, here are the charts of the prices of gold and silver, and the gold-silver ratio.
We extended the chart back two years, to put the move in silver into perspective. The price of gold is within its trading range. However, the price of silver is scraping the bottom. Will the prices of the metals keep falling? Read on.
Next, this is a graph of the gold price measured in silver, otherwise known as the gold to silver ratio. The ratio rose further. Again, we extend the graph to two years to show context.
In this graph, we show both bid and offer prices for the gold-silver ratio. If you were to sell gold on the bid and buy silver at the ask, that is the lower bid price. Conversely, if you sold silver on the bid and bought gold at the offer, that is the higher offer price.
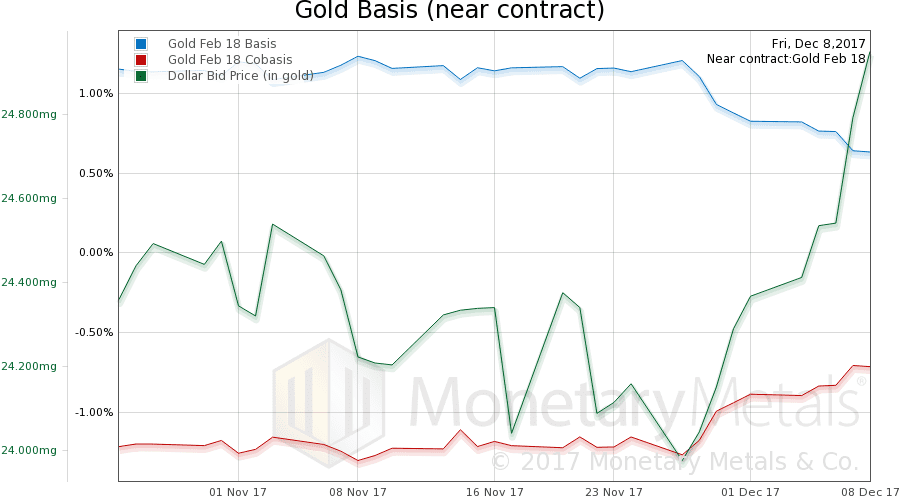
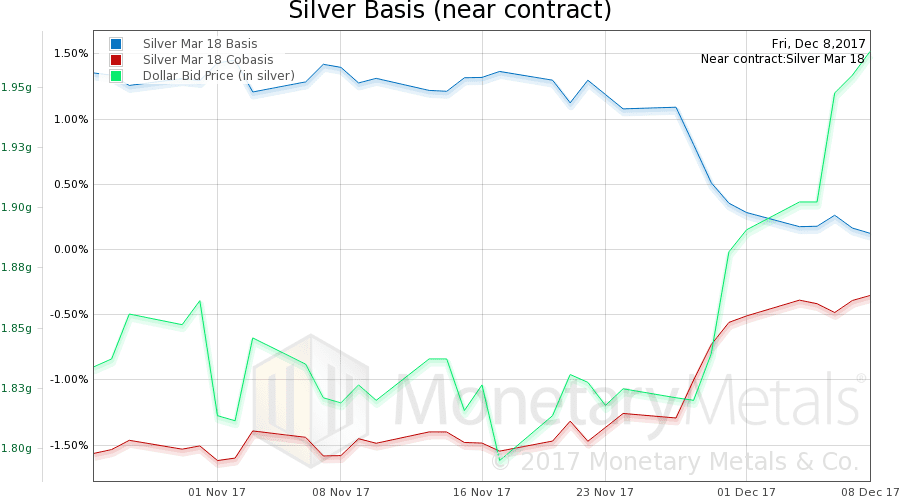
For each metal, we will look at a graph of the basis and cobasis overlaid with the price of the dollar in terms of the respective metal. It will make it easier to provide brief commentary. The dollar will be represented in green, the basis in blue and cobasis in red.
Here is the gold graph showing gold basis and cobasis with the price of the dollar in gold terms. We have done the opposite with this graph, zooming in on the past month and a half.
You can clearly see the skyrocketing price of the dollar (i.e. falling price of gold, measured in rubber band dollars) starting late in November. It went from 24 to 25mg, or about 4%.
At the same time, gold became a little scarcer, the cobasis (our measure of scarcity) gained over 50bps.
Our Monetary Metals Gold Fundamental Price is designed with the idea that speculators use leverage in their trades. Accordingly, they can move the price in the short term but they have to get out and close their positions. So we back out their effect on price, to answer the question “at what price would metal be clearing today, if not for leveraged speculators?”
It is a much less volatile view of the market. While the market price of gold has dropped $46, our fundamental price has stayed in its range and has risen a few bucks.
In other words, nothing has happened to the fundamentals of gold supply and demand, notwithstanding changes to sentiment and trading positions of leveraged speculators. Perhaps they are freeing up capital to begin trading bitcoin futures?
Now let’s look at silver.
In silver terms, the dollar has risen even more sharply, from 1.82g to 1.96g, or about 8%. And we see a rising cobasis, well over +90bps. Compared to gold, this is not only a bigger move, but potentially more significant as this is the March contract, or 30 days farther out than the February gold contract.
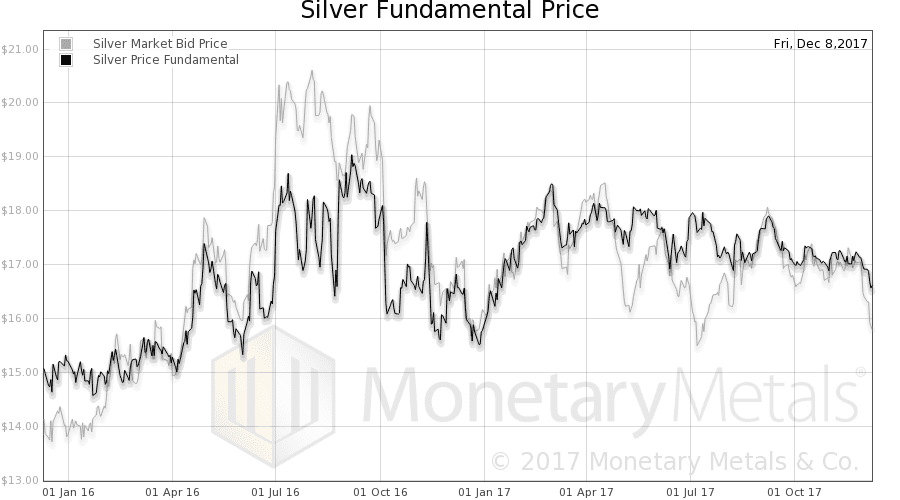
The Monetary Metals Silver Fundamental Price has dropped, however, about 50 cents since Nov 27, about 30 cents this week. It is now about 80 cents above market.
As you can see on the chart below, which shows the market and fundamental prices going back two years, the fundamental price has not broken down as much as the market price.
Last week, we said:
“It is not the purpose of this letter to say what traders ought to do. We can say that, in our fund (which trades the gold-silver ratio) we are long silver for the first time since the summer.”
Well, a big drop on dollar-denominated prices but not a big rise in the gold-silver ratio. A drop in the fundamentals is not necessarily a good time to buy, if you’re trading silver against dollars. But on the other hand, the market price has dropped twice as much.
One thing is for sure. This is not the goldmageddon or silverpocaylpse that some of the more aggressive bitcoin bugs are calling for. Such as John McAfee, who said:
“Gold is laughable compared to cryptocurrencies. How do you frationalize [sic] gold? How do you ship it? It’s physical so how do you safely store it. It was good for people 3,000 years ago. Today it is inherently worthless. Soon it will drop in value as crypto currencies climb.”
© 2017 Monetary Metals


0 comments:
Post a Comment