Thursday, December 31, 2015

Silver Prices: Why a 42% Move in Silver Could Be Possible in 2016

Published here: http://www.profitconfidential.com/silver/silver-prices-why-a-42-move-in-silver-could-be-possible-in-2016/

1 Reason Why Silver Prices Outlook for 2016 Is Bullish
Silver prices remain suppressed for now, but don’t be shocked if 2016 is a big year for the gray precious metal.

One thing must be understood: the silver supply side is getting crushed.
Major Silver-Producing Countries Reporting Declines
Each day, we have more evidence that suggests silver production in different mining regions is plummeting. We also see silver producers are facing severe scrutiny and some are resorting to desperate measures, trying to change their business model and resorting to.

The post Silver Prices: Why a 42% Move in Silver Could Be Possible in 2016 appeared first on Profit Confidential.

Something Broke In The U.S. Silver Market

Published here: http://www.zerohedge.com/news/2015-12-30/something-broke-us-silver-market


Something Broke In The U.S. Silver Market

Posted with permission and written by Steve St. Angelo, SRSrocco Report (CLICK FOR ORIGINAL)


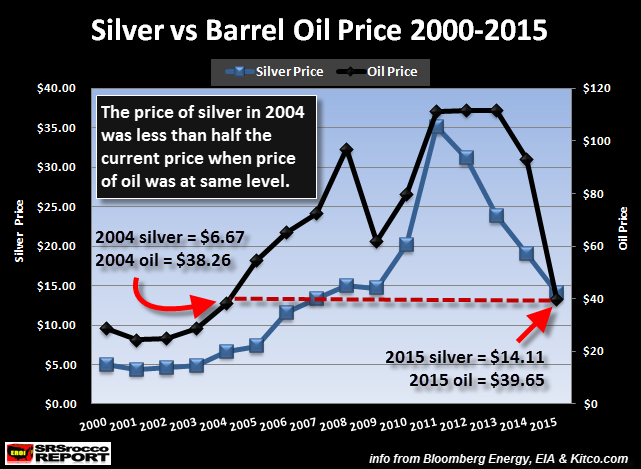
After looking over all the figures, it seems as if something broke in the U.S. Silver Market this year. By that, I mean the normal supply and demand forces no longer make sense. I believe this stemmed from the massive amount of physical silver investment demand beginning in June as financial and geopolitical events pushed the retail silver market into severe shortages.

To start off, the United States has been the largest importer of silver in the world for many years. Even though India has imported more silver recently, its annual amount has fluctuated widely, while the U.S. has been more consistent.

For example the U.S. silver imports have ranged between 4,500-6,000 metric tons (mt) a year, while India imported between 2,000-7,000 mt. Overall, the U.S. is the clear winner by importing a total of 39,500 mt of silver from 2007 to 2014, while India totaled 31,700 mt.

To put these metric ton figures into perspective… look below:

Total U.S. Silver Imports 2007-2014 = 1.27 billion oz

Total India Silver Imports 2007-2014 = 1.02 billion oz

The reason the U.S. imports so much silver is due to its large industrial silver manufacturing industry. Here were the top five industrial silver fabricators in 2014, according to the 2015 World Silver Survey:

China = 5,788 mt

U.S. = 3,902 mt

India = 1,470 mt

Germany = 652 mt

S. Korea = 652 mt

While China is the largest industrial silver fabricator in the world, it also produces a lot more domestic silver than the U.S. In 2014, China produced 3,568 mt of silver, while U.S domestic mine supply was only 1,169…. three times less. So, the U.S. must import more silver than China to meet its total fabrication needs.

Furthermore, the U.S. Mint has been producing more Silver Eagles each year, which requires additional imports of the metal. Now, with that basic ground work, let’s look at why the U.S. Silver Market dynamics were altered this year.

Something Changed In The U.S. Silver Market

As I mentioned in several articles, U.S. silver imports surged at the beginning of the year. This continued with another whopping 533 mt of silver imported in September for a total of 4,476 mt for the first three-quarters of the year:

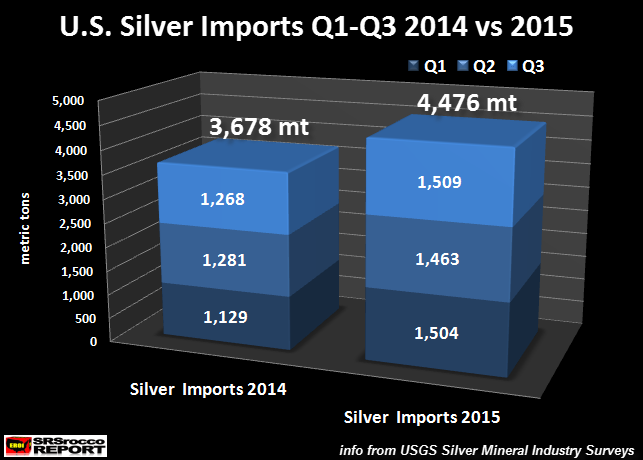
Thus, total U.S. silver imports are up 798 mt from the 3,678 mt imported last year during the same time period. Which means, the U.S. imported an extra 25.6 million oz (Moz) of silver this year over last. That’s a lot of silver.

NOTE: These U.S. silver imports are bullion and dore bars. Silver bullion is high quality bullion ready to be used as investment or fabrication, while dore bars are semi-pure bars poured at the mines needing further refinement.

Why all this extra silver? Was it due to industrial demand? Well, let’s take a look. These next two charts show the change in U.S. industrial silver imports and exports (Q1-Q3) compared to last year:

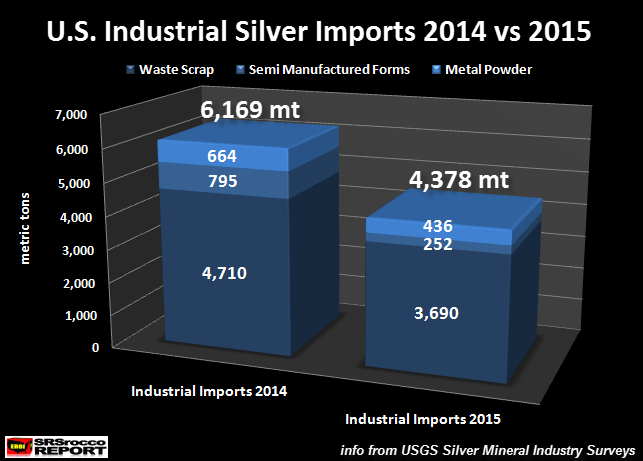
According to the USGS, the U.S. imported more silver waste silver scrap (4,710 mt vs 3,690 mt), semi manufactured forms (795 mt vs 252 mt) and powdered silver (664 mt vs 436 mt) in the first three-quarters of 2014 compared to 2015. The total silver imports of these three industrial categories was 29% lower this year compared to 2014.

Okay, how about U.S. industrial silver exports:

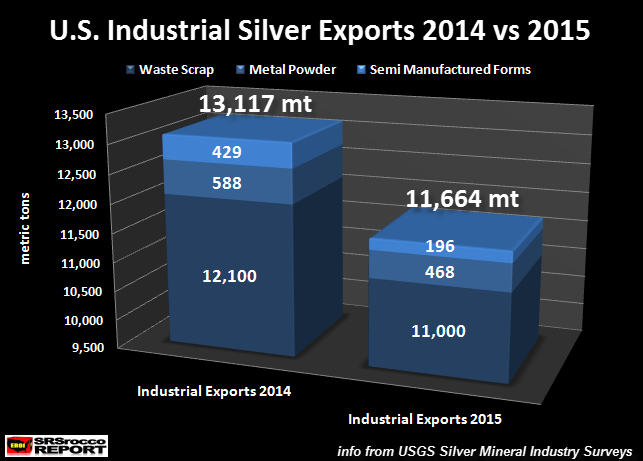
Here we can see the same trend. The U.S. exported less silver waste scrap, semi manufactured forms and silver powder this year to date compared to the same period in 2014.

NOTE: There are two other categories of industrial silver imports-exports, however I did not include them as their total figures were much smaller than the three listed above. In addition, even though total U.S. silver waste scrap tonnage is significant (11,000 mt ytd), it turns out to be only worth 33 cents an ounce.

Now, if we take the net change for Q1-Q3 2014 vs 2015, this is the result:

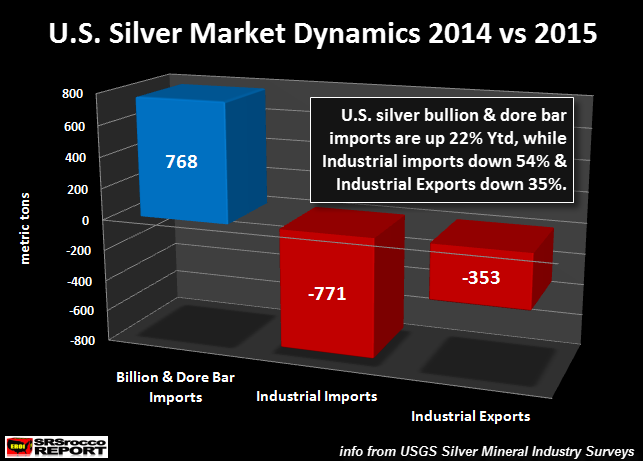
As we can see in the chart above, the U.S. imported 798 mt of silver bullion and dore bars Q1-Q3 compared to last year, but industrial silver imports (silver powder & semi manufactured forms) were down an astonishing 771 mt and industrial silver exports were down 353 mt.

When I made the chart above, I only included the two fabricated silver components of semi manufactured forms and silver powder. So, as total silver imports surged, industrial silver imports plummeted while industrial silver exports declined significantly.

Again, why did the U.S. import so much more silver this year if industrial silver supply and demand were down considerably compared to last year. If U.S. silver imports continue to be strong for the remainder of the year, it could reach over 6,000 mt. The last time the U.S. imported that much silver was in 2011.

I went back and looked at the data for 2011 and found some surprising results. If we compare U.S. silver supply and demand for the first three-quarters of 2015 vs 2011, this is the outcome:

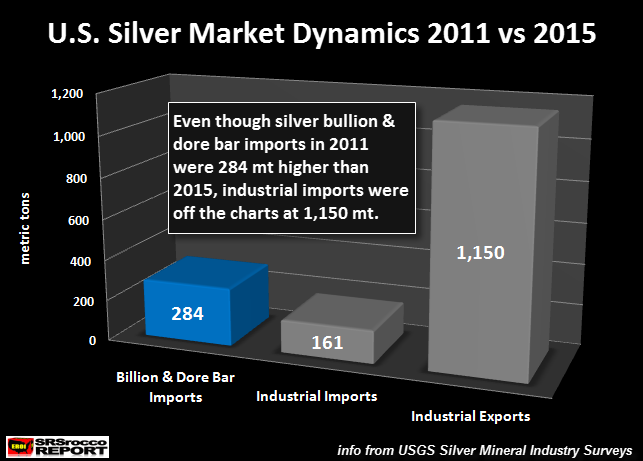
Even though the U.S. imported 284 mt more silver bullion and dore bars during the first three-quarters of 2011 than during the same period this year, industrial silver imports were 161 mt higher and industrial exports a staggering 1,150 mt larger. So, it made sense for the U.S. to import 6,300 mt of silver in 2011.

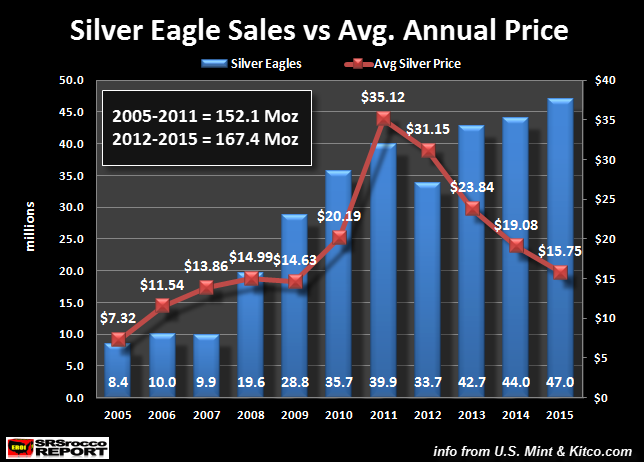
However, this wasn’t the case this year. So, again… where did this silver go? Maybe some of it went into the surging physical investment demand. If we look at the next chart, we can see that U.S. Silver Eagle sales hit a record 47 Moz this year:

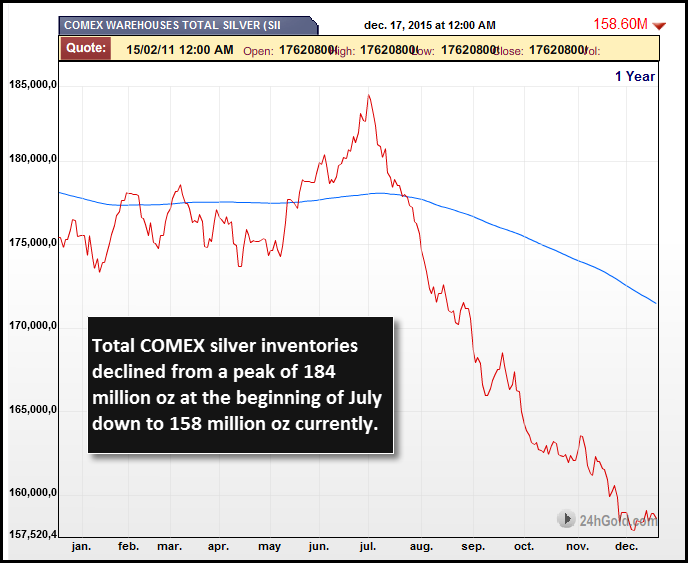
While total Silver Eagle sales were 7 Moz higher this year versus 2011, the Comex silver inventories also fell from a high of 184 Moz in the beginning of July down to 158 Moz currently:

To sum this all up, the U.S. has imported 20% more silver in the first three-quarters of 2015 compared to last year while industrial demand has fallen considerably and the COMEX silver inventories declined 26 Moz from its peak.

So, for whatever reason… there is more silver coming into the U.S. than the market dictates. Of course, physical silver investment demand is much higher this year, but it doesn’t account for all the extra silver imports. Thus, some large entities must be acquiring silver off the radar.

Why Did The U.S. Silver Market Break From Its Normal Market Dynamics

According to the USGS silver import-export data, the U.S. Silver Market is behaving much different from previous years. As I stated, U.S. silver bullion and dore bar imports hit a record 6,000 mt in 2011. However, this was due to elevated industrial silver demand and exports.

This year, the U.S. is on track to import 6,000 mt, but industrial silver supply and industrial exports are down considerably. Which means, the huge increase in U.S. silver imports must be due to physical silver investment demand. This doesn’t make sense as the price of silver is trading at a four-year low.

As I mentioned, there was a large decline of silver inventories at the COMEX this year. Furthermore, according to the 2015 Silver Interim Report by the GFMS Team at Thomson Reuters, they show a 17.1 Moz net decline of Global Silver ETF inventories, while physical bar and coin demand rose to 206.5 Moz this year.

Looking at the following chart from my article, DEATH OF PAPER GOLD & SILVER: The Data Proves It,

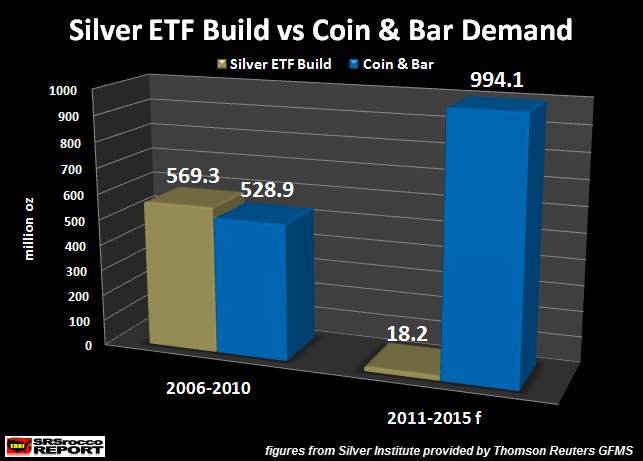
we can see the drastic change of investor sentiment for physical silver bar and coin over Global Paper Silver ETFs. In over the past five years, Global Silver ETF inventories experienced a net build of 18.2 Moz compared to 994 Moz of physical silver bar and coin demand. Moreover, that figure is conservative due to the fact that the GFMS Team at Thomson Reuters does not include private silver rounds (bars) in their data.

Again, something broke in the U.S. Silver Market this year. I believe it had to do with the beginning shock of a possible Greek Exit of the European Union and continued by the threat of a U.S. and broader stock market collapse. Even though the Fed and Central Banks continue to prop up highly inflated over-leveraged Bonds & Stocks, this is not a long-term sustainable economic policy.

At some point, investors (especially wealthy investors and institutions) will start buying physical gold and silver to protect wealth before the collapse of the Greatest Ponzi Scheme in history begins in earnest. It will only take a small percentage increase of new buyers, say 2-3%, to totally overwhelm the precious metal market. When I say 2-3% new buyers, I am referring to those currently invested in paper assets.

The U.S. Silver Market broke a trend this year which I believe is significant going forward. While precious metal investors may be frustrated by the low paper price of gold and silver.. the fundamentals for owning the metals are stronger than ever.


Please email with any questions about this article or precious metals HERE


Something Broke In The U.S. Silver Market

Posted with permission and written by Steve St. Angelo, SRSrocco Report (CLICK FOR ORIGINAL)


Independent researcher Steve St. Angelo (SRSrocco) started to invest in precious metals in 2002. Later on in 2008, he began researching areas of the gold and silver market that, curiously, the majority of the precious metal analyst community have left unexplored. These areas include how energy and the falling EROI – Energy Returned On Invested – stand to impact the mining industry, precious metals, paper assets, and the overall economy.

You can find many of Steve’s articles on many noteworthy sites. Visit Steve at https://srsroccoreport.com.


Wednesday, December 30, 2015

NEW: Money Metals Issues 2016 Gold/Silver Forecast

Published here: http://goldsilverworlds.com/gold-silver-experts/new-money-metals-issues-2016-goldsilver-forecast/

NEW: Money Metals Issues 2016 Gold/Silver Forecast

Looking Ahead to 2016

Forecasting today’s volatile, high-frequency machine driven and manipulated futures markets using fundamental analysis is futile, as a great many precious metals bulls will attest. To complicate matters, an obsession with Fed policy dominates all markets. Officials at the Federal Reserve are often less than forthcoming and are just as bumbling as the Soviet bureaucrats when it comes to centrally planning our economy.

Nevertheless, beneath all of the artificial influences and all of the leveraged paper, the gears of the physical market for gold and silver still turn. We can be sure prices will reflect actual supply and demand for physical metals at some point, even if we do not know when. With that in mind, here is a look ahead to 2016…

Supply Destruction

Silver production peaked in 2014, while gold production is expected to peak in 2015. Falling prices make an increasing number of mining projects uneconomic. Lower fuel costs are helping, but the average all-in cost of production for silver is estimated at around $17/oz and for gold at around $1,150/oz.

Today precious metals sell for well below than their all-in production cost. Primary producers of gold and silver will deliver less to market in 2016 given that a great many miners currently take a loss on every ounce they sell.

But there is another factor likely to decimate supply in 2016. Base metal prices, including for copper, fell dramatically this year, and the outlook is not too bright for the year ahead. The Chinese economy, the world’s largest market for commodities, is slowing. Brazil is in real trouble and economists are worrying more about the possibility of recession around the world.

Supply and DemandSlumping demand for base metals will impact supply of gold and silver because huge quantities of these precious metals are produced as a byproduct of mining for base metals such as copper and zinc. The reorganization of Anglo-American PLC, one of the world’s largest mining conglomerates, earlier this month highlights just how difficult the current environment is for producers – regardless of which metal they are mining.

Gold and silver prices have been in decline since 2011, but it is only during the past year that average prices will finish well below even the most conservative estimates of production costs. The recent carnage in base metals will add significantly to constraints on precious metals supply in the months ahead.

Physical Demand Rising

Investment demand for physical bullion is perhaps the biggest story in precious metals for 2015. Mints and refiners spent much of the 2nd half of the year unable to keep up. Investors had to contend with higher premiums and delivery delays, finally getting some relief now as the year draws to a close.

Only time will tell if 2016 can top this year’s record. We look set to enter the New Year in much the same way we entered 2015 – with steady, but far from overwhelming buying activity for fabricated coins, rounds, and bars. Investors loaded up in recent months and now await the next catalyst.

Silver and Gold Demand RiseIt may be price action. Lower spot prices over the past 4 years have been a big driver of demand. And prices moving consistently higher will also inspire demand from newcomers (as we saw during the last bull cycle between 2009 – 2011). Only flat or range-bound prices typically lead to investor apathy.

As always, geopolitical events will play a big part in whether or not metals benefit from safe-have buying. In 2016, investors will be watching the ongoing saga surrounding Greece and other hopelessly indebted European nations. The U.S. is at odds with Russia in the Middle East and in Ukraine.

And recent tremors in high-yield debt markets may be advance warning that extraordinary leverage is about to rock financial markets once again. These stories, and others no one can predict, have potential to generate a flight to safety in the coming year.

Industrial demand for gold and silver may turn out to be tepid for 2016. This is less of a factor in gold markets than for silver, where manufacturers consume a good portion of what is produced annually. As mentioned above, some economists worry about the possibility of recession in the coming year. Any slump will weigh on demand for items such as jewelry and other goods. However, a lot of industrial demand comes from high-growth sectors which have proven resilient during past recessions. Electronic, solar, and healthcare related applications for silver come to mind.

Some 2016 Wildcards

Delivery defaults are possible in the futures markets. The explosion of leverage in COMEX gold futures bears watching in 2016. The number of registered bars available for delivery in exchange vaults relative to the number of paper ounces being traded shrunk dramatically to record lows in recent weeks. It’s a trend that simply cannot go on very much longer – not at the current pace of decline.

Reforming America's Monetary SystemExchange participants may convert more gold stocks from “eligible” to the “registered” category. That’s possible, though there is good reason to wonder how much physical metal the holders want to part with at current prices. The precipitous drop in registered stocks may well be signaling they are more than a little reluctant to part with it.

If holders of silver and gold futures contracts start standing for actual delivery of more metal than the COMEX has available to deliver, or should traders even begin to seriously entertain that possibility, we’ll see some fireworks.

Leading Republican candidates are making noises about sound money. Donald Trump, Ted Cruz, Rand Paul, and Ben Carson all have questioned the wisdom of Fed policy. Republicans everywhere are critical of federal debt and deficits and have been for decades now. Given the Party’s atrocious record of turning the talk into actual policy, we should remain skeptical that any elected Republican leader will actually achieve reform.

But there can be no doubt that the sound money issue is gaining traction. We can’t rule out someone in the crowded field of candidates tapping into the popular outrage over out-of-control borrowing and spending. Should ideas like reinstituting gold backing for the dollar gain serious momentum in the campaign, the metals markets could perk up.

Clint Siegner is a Director at Money Metals Exchange, the national precious metals company named 2015 “Dealer of the Year” in the United States by an independent global ratings group. A graduate of Linfield College in Oregon, Siegner puts his experience in business management along with his passion for personal liberty, limited government, and honest money into the development of Money Metals’ brand and reach. This includes writing extensively on the bullion markets and their intersection with policy and world affairs.

How Western Bankers SERVE Precious Metals Holders

Published here: http://www.zerohedge.com/news/2015-12-30/how-western-bankers-serve-precious-metals-holders


Hold your real assets outside of the banking system in a private international facility  -->  http://www.321gold.com/info/053015_sprott.html 


.


How Western Bankers SERVE Precious Metals Holders

Written by Jeff Nielson (CLICK FOR ORIGINAL)


For the last four years (in particular), those who have chosen to convert their paper wealth into gold and silver have been suffering – just ask them. It might be time to remind these individuals of an old adage:

Be careful what you wish for; you just might get it.

Playing the “what if” game with precious metals markets (and invoking the old adage) is relatively simple. For instance, what if the silver market had not been subjected to the most ruthless financial attack on a commodity market in the history of commerce?

Back in the spring of 2011, it was the silver market that was leading the way through the strongest segment of what was (at the time) a ten-year, uninterrupted bull run in precious metals markets. This is a matter of both empirical and historical fact. The trough-to-peak move in the silver market during that run was much greater in magnitude than the same move in the gold market. Historically, the trough-to-peak move in the silver market is always stronger.


For the sake of simplicity, let’s assume that there were only two possible alternative scenarios if precious metals markets had not been subjected to the price capping operation of 2011 and the permanent (until default) price suppression we have seen in these markets since that time. Let’s call one possibility the “fair-price” scenario, and let’s call the other one the “full-price” scenario.

Then we have our definitions. The “fair-price” scenario is defined as a partial move in gold and silver markets, where the prices move roughly halfway toward their full value. The “full-price” scenario, as the name implies, means a full price for gold and silver, or as close to full price as we can get, given that Western paper currencies are already worthless .

For readers not familiar with previous commentaries, a “full price” for precious metals today waspreviously pegged at $10,000/oz for gold, and $1,000/oz for silver. For the purpose of this analysis, the fair-price scenario will peg the price of gold at $5,000/oz and the price of silver at $200/oz. The fair- price scenario represents a partial reduction in the utterly absurd gold/silver price ratio, while (naturally) the full-price scenario represents a relatively correct gold/silver price ratio, given the depletion of global stockpiles of silver.

Let’s begin with the fair-price scenario. It is undoubtedly the more benign scenario, since it does not require precious metals holders to make the most difficult decisions. Imagine the full implications of $5,000/oz for gold and $200/oz for silver.

At those prices, gold and silver holders would already be listening to a deafening crescendo from the mainstream propaganda machine. Gold is a bubble! Silver is a bubble! Run for your lives! Simply remember how loud that cacophony grew with gold under $2,000/oz (USD) and silver still below $50/oz (USD).

Thus, we begin our benign scenario with precious metals holders already feeling intense psychological pressure to reduce their concentration of wealth in gold and silver. Add to this struggle the “wealth effect,” where the paper exchange rate for gold and silver would make precious metals holders feel much wealthier.

Part way into the benign scenario, gold and silver holders would be seeing/reading/listening to a constant propaganda barrage urging them to “diversify” out of their gold and silver, or face the consequences. Meanwhile, feeling much wealthier (with the same amount of metal), many precious metals holders would conclude that they didn’t need all of that gold and silver, the trouble of storing it, or the added cost of insuring it at higher prices. They’d think, “Why not lighten the load and take some (paper) profits?”

Of course, most of us would not have much metal to begin with in the fair-price scenario. If the price of gold and silver had not been capped (and then reversed) with gold below $2,000 and silver below $50, it would have cost us much, much more for each ounce we purchased between 2011 and today. This means (unless we had inexhaustible wealth) that we would start our fair-price scenario with fewer ounces of metal and then have to fight the psychological impulse to sell that is fuelled by media propaganda and our own delusions of greater wealth.

Now it’s time for us to move to the full-price scenario, where gold and silver holders “get what they deserve.” Let’s think about what a wonderful world that would be. To begin with, we would have even less metal, as the much higher paper exchange rate would dramatically reduce our purchasing power.

And remember how much sell-and-run propaganda came from the mainstream media with gold at $5,000/oz and silver at $200/oz? Now imagine the decibel level of that Chicken Little propaganda when the price of gold doubled, yet again, and the price of silver quintupled (after an already greater-than-tenfold rise in price).

Imagine dealing with that “sell, sell, sell” pressure every day, while simultaneously feeling much wealthier. How long could we listen to the chant of “Bubble, BUBBLE, BUBBLE!” from the mainstream media before we began to reallocate our wealth away from gold and silver

What would we hold instead of our gold and silver? Bushels of wheat? Barrels of oil? A warehouse-full of lumber? True, we could follow those wealthier than ourselves and funnel our gold and silver into high-priced art, or antiques, or some other wealth-preservation vehicle of the Ultra Wealthy. But this presents two additional issues.

First of all, when the Ultra Wealthy put some of their wealth into such vehicles, they do so to shelter their wealth from the Tax Man. And they have no need, or intent, to liquidate such holdings in “an emergency.” Most of the people reading this commentary will not fall within that privileged group.

If we choose to move our wealth out of gold and silver and into art and antiques – with these asset classes already at record prices – we do so with the knowledge that we may be forced to sell these less-than-liquid assets during a trough in the market. Out of the frying pan and into the fire. Moving from one (supposed) asset bubble to another, less-liquid asset bubble is not the path to “financial security.”

Of course, we could not move our wealth directly from gold and silver and into art-and-antiques, or even into other commodities. First we would have to convert our gold and silver back into the bankers’ paper currencies (sell our metal). But now we are traders of gold and silver, and we say hello to the Tax Man.

Different readers around the world with different income levels would face different “hits” as the Tax Man took his cut, so readers are invited to pull out their calculators and think about how much of their wealth would evaporate into taxes, should they liquidate any substantial amount of their bullion holdings with gold at $10,000/oz and silver at $1,000/oz, or even at the previous fair-price numbers.

After facing the taxation consequences, we would be trying to move between asset classes without assurance that (priced in the bankers’ worthless paper) the new asset class would be at any less of a “bubble” price.

Of course, we haven’t yet arrived at the best part, should precious metals holders be lucky enough to see a “fair” or “full” price for gold and silver today. As regular readers have been warned in these commentaries, we enter the New Year facing another scenario: the Next Crash in 2016. The bankers scripted this nightmare for us right after the Crash of ’08 ended.

Imagine feeling the daily pressure of the media “warning” you that the gold and silver bubbles were going to implode “in a deflationary crash” in the near future. Imagine your joy as you watch the Tax Man snatch a large chunk of your profits from whatever portion of your gold and silver you liquidated to alleviate that pressure, and then imagine choosing another asset class in which to invest the remains.

Now imagine trying to juggle those financial pressures knowing that the greatest economic crisis of our lifetime could come at any time – like tomorrow.

There are worse things in life than being able to exchange debauched paper currencies for gold and silver at absurdly advantageous prices. An ounce of silver costs little more than an average pound of steak in Canada today, an even more advantageous ratio than when the ten-year bull run began in gold and silver, and silver was priced at under $5/oz.

There are worse things in life than going to sleep at night feeling financially secure, with not the slightest doubt that your wealth is misallocated and not the slightest intention of liquidating even a single ounce of bullion – with gold and silver ridiculously undervalued. Certainty and security. How much is that worth?

Yes, there are worse things in life than the suffering we have been forced to endure in the gold and silver markets over the past four years. Be careful what you wish for, you just might get it.


Please email with any questions about this article or precious metals HERE


How Western Bankers SERVE Precious Metals Holders

Written by Jeff Nielson (CLICK FOR ORIGINAL)


Jeff Nielson is co-founder and managing partner of Bullion Bulls Canada; a website which provides precious metals commentary, economic analysis, and mining information to readers/investors. Jeff originally came to the precious metals sector as an investor around the middle of last decade, but soon decided this was where he wanted to make the focus of his career. His website is www.bullionbullscanada.com.

Why Austrian Investing Is Important In The Era Of State Imposed Fiat Money

Published here: http://goldsilverworlds.com/investing/why-austrian-investing-is-important-in-the-era-of-state-imposed-fiat-money/

We are living in extreme times. When it comes to investing, the economy and markets, the extreme monetary policies of central banks all over the world should be top of mind of every investor.

To make our point, we refer to the 3 following charts that readers know by now … But it always helps to put things in perpsective. Our focus here is on the time period as of 1971 which will likely go in history books as the era of the “Great Monetary Experiment” (or something alike).

An explosion of the monetary base. Nothing new here, but notice the trend as of 1971, and the different phases of acceleration in growth of the monetary base.

austrian_money_supply_1971_2015

Real interest rates since 1971. Between 1971 and 1980, there was some sort of attempt to stabilize real interest rates, but as of 1980 the masters of the central bank have been pushing real interest down.

interest_rates_1971_2015

As a result of the previous two trends, the value of our currency has gone one (and only one) direction: down. These are simple economic laws: the more currency available, the lower its value, and gold has the ultimate characteristic to measure that.

GOLD-vs-currency_1971_2015

Today’s complex economic and finanical environment requires a prudent investment approach. That’s where Austrian investing can play an crucial role. Although Austrian economics is witnessing a growing follower base, not much has been written about Austrian investing principles.

As of now, however, investors have a comprehensive guide at their disposal: the book “Austrian School for Investors: Austrian Investing between Inflation and Deflation” written by Rahim Taghizadegan, Ronald Stöferle, Mark Valek and Heinz Blasnik.

John Hathaway, Senior Portfolio Manager of Tocqueville Gold Fund, wrote the following in his foreword:

“The financial markets of today are dominated by hyper active high frequency trading guided by trend following quantitative algorithms. Original thought is replaced by artificial intelligence. Market prices are manipulated and gamed by institutional and political interests. Valuations are inflated by the zero interest rate policies of all central banks for whom it is dogma to drive up the prices of paper assets to influence the behavior of individuals and corporations to achieve their announced goals of full employment, moderate inflation, and financial market stability. Financial wealth has become an illusion that has little resemblance to real wealth. Financial wealth is dependent on the functionality of a matrix that must be navigated according to its unique rules that are often at odds with common sense. For those who fear that the functionality of this matrix is unsustainable, The Austrian School for Investors offers a path to the kind of critical thinking that will provide sustainability for its practitioners long after the demise of the artifice of paper wealth.”

Along the same lines, we very much like the following quote which is copied from the introduction of the book:

“Confusion and uncertainty with regard to investing have rarely been as pronounced as they are today. On the one hand, we are living in an era in which wealth can seemingly grow to incredible heights. On the other hand, there are always rumors of crisis – a dark premonition that security prices could collapse at any moment, and the savings of a lifetime could be decimated overnight. Although official data show only moderate inflation, in some cases even deflation, many people feel that their currency is continually losing value. Most of them suspect that they should give a bit more thought to preserving the value of their savings, but are faced with contradictory advice. Trust in “experts” is declining, whether they are economists, bankers or politicians. If someone dispenses investment advice, he wants to make money from it – just as everyone seems eager to make money from retail investors.

It is difficult for investors to do the right thing, but incredibly easy to make a mistake. The current economic environment seems like a game with marked cards, with the odds of winning systematically stacked against the multitude of small players. One gets the impression that it is all a giant rip-off.”

Uncoincidentally, the authors have focused on the monetary system, as without a deeper understanding of the monetary system it is impossible to understand current investment trends.

Looking at the above charts, it goes without saying that a new financial crash is in the making. And that’s where Austrian investing can save your wealth.

Why? Because times during which the monetary system was impaired were always times when monetary theory made great strides. In times of crisis, the enduring value of the Austrian School comes to the fore. It is no great feat to make money during a boom – it practically self-multiplies. Good investors differentiate themselves from bad ones in times of crisis. The most famous recent example of an investor who succeeds in times of crisis is probably Nassim Taleb, who is clearly influenced by the Austrian School. His long-term partner and even more successful investor, Mark Spitznagel, has written a book on “Austrian” investing as well.2 A book that, although penned by a practitioner, is far more theoretical and philosophical in its approach to the topic than this book.

Analysis grounded in Austrian thinking has been remarkably accurate in separating illusion from reality. It provides a sensible, highly accessible big picture of view of what exists and what is likely to happen as a result. That is because it portrays economic activity and likely developments as the product of individual behavior, a common sense and practical framework. It does not employ abstract groups or forces that are somehow quantified and correlated by unintelligible formulas, a methodology that succeeds only in explaining the artificial reality that it has created.

The Austrian analytical framework is not a prescription for short term investment success or even a pathway to building a fortune. There is no such magic here. However, it does provide a foundation for sanity in the midst of mass delusion. It is grounded in ethical behavior, common sense, and sober reflection. The Austrian investment approach eschews leverage, promotions, and fads. It is likely to steer one away from disastrous investment outcomes through a balanced approach to wealth preservation. In short, the Austrian methodology is based on reality, not fancy, and its application in daily practice will provide an investor with favorable odds to achieve financial well-being.

Let’s not forget that the Austrian theory is not ‘exotic’. On the contrary. Two of today’s most famous investors are testament to this: Warren Buffet’s father was strongly influenced by the Austrian School and passed important insights to his son. George Soros’ longtime partner and most important analyst Jim Rogers is also an Austrian School adherent. Benjamin Graham, Buffet’s teacher and mentor, developed a methodology that shows astonishing parallels to the Austrian School’s ideas, although Graham actually was not aware of it. Lastly, the Austrian School originated when its founder Carl Menger, who worked as an economic journalist, came to realize by observing activity on the stock exchange in great detail that classical economics was unable to explain the real world.

The book “Austrian School for Investors: Austrian Investing between Inflation and Deflation“does not introduce a new investment fad, it is not an advertisement for a new investment product and not an ideological program. It aims to make knowledge that is highly useful in dealing with the questions of our time but has been unjustly forgotten, available to the average investor. It is based on the research of an economic school of thought that has only in recent years slowly been rediscovered by the broader public, because it was once again proved to be prophetic. In the history of ideas, this tradition is known as the “Austrian School” or the “Viennese School of Economics”. Engaging with the Austrian scholars of yesteryear is tantamount to being inoculated against all sorts of illusions. The Austrian school makes clear why the so-called “orthodox” perspective on the economy, savings and investment borders on irresponsibility. While the Austrian School definitely offers a kind of therapy, it is not a ready-made miracle cure, but rather a thorough program in disillusionment helping to activate one’s own mind.

In sum, this book is to date the most comprehensive attempt at a critical examination of today’s investment universe from the perspective of the Austrian School and deriving conclusions for investors from it. To this end, we frequently move back and forth between theory and current practice. The difficulty of connecting these two worlds will become clear to the reader as the book progresses: the relationship between taking the time for slow and deliberate reflection and the pressure and urgency that characterize investing in financial markets under distorted and volatile circumstances.

More about this book on Amazon.

Tuesday, December 29, 2015

Silver and S&P Similarities – Tops and Bottoms

Published here: http://goldsilverworlds.com/gold-silver-experts/silver-and-sp-similarities-tops-and-bottoms/

Examine the 30 year log scale chart of the S&P 500. What I see:

S-S&P


  1. Tops occurred about every seven years. Tops were usually rounded, followed by intense drops.
  2. Tops were approximately Aug. 1987, Jan. 1994, March 2000, Oct. 2007, and May 2015.
  3. Once the S&P broke below the red up-trending support lines in 2000, 2007, and (probably) in 2015, the rally was over and large corrections occurred.
  4. The next large move in the S&P looks like it should be, based on history, a substantial correction to the 600 – 1,400 range.

Other Considerations:

  1. Federal Reserve easy money has helped create the last six years of S&P rally. The Fed has been propping up the stock and bond markets while it has been antagonistic to the silver and gold markets.
  2. Investors, Wall Street, pension funds, and more will scream in anguish if the S&P crashes. The upcoming correction/crash could be worse than the 2008 crash.
  3. Market breadth, P/E ratios, other fundamentals, crashing commodity prices, and accelerating wars also indicate a likely correction.
  4. We have been warned, just as we were in 2000 and 2007.

Shorter Term:

Examine the weekly S&P 500 on a log scale for two periods, 2003 – 2008, and 2010 – 2015. There are similarities.

S-S&P-wkly-4

S-S&P-wkly-3

  1. Significant bottoms: 3/14/03, 8/13/04, 8/17/07, 11/30/07
  2. Significant bottoms: 7/2/10, 9/23/11, 10/17/14, 8/28/15
  3. Major top: 10/12/2007
  4. Major top: 5/22/2015

The bottoms and single top line up fairly well.

Note that five months after the 2007 high the S&P bottomed in March 2008, rallied back into May 2008, and crashed from there.

Three months after the May 2015 high the S&P bottomed in late August 2015, rallied back to November 2015, and — we are waiting to see if a crash occurs in 2016.

WHAT ABOUT SILVER?

Examine the 30+ year log scale chart of (paper) silver. Note the major lows in silver prices, as indicated.

S-Silver-xx

Silver lows occurred about every seven years in May 1986, February 1993, November 2001, October 2008, and December 2015. Now compare the silver lows to the S&P highs over the past 30 years.

S&P Tops Silver Bottoms

August 1987 May 1986

January 1994 February 1993

March 2000 November 2001

October 2007 October 2008

May 2015 December 2015

The S&P tops line up moderately well with silver bottoms. The last three S&P tops have preceded silver lows.

WHAT DOES THIS PROVE?

In my opinion this proves very little, but the above certainly SUGGESTS the following:

  1. The S&P has peaked about every seven years and the peak in May 2015 probably marked the end of this seven year cycle.
  2. The next big move in the S&P will probably be down, based on cycles, the 30 year charts and the five year charts.
  3. Silver bottoms occur about every seven years and roughly line up with S&P tops. Assuming the S&P has topped, that supports the expectation for a silver low in December 2015 or perhaps 2016-Q1.
  4. The next big move in silver should be a substantial, multi-year rally to much higher prices. My 5 – 7 year estimate is $100 per ounce for physical silver.
  5. Continuing central bank “money printing,” currency devaluations, fiscal and monetary madness, unsustainable debt levels, massive deficits, and accelerating wars suggest higher silver prices.
  6. In the long term, silver prices increase along with US government official national debt, deficits, and dollar devaluations. Increasing debt, deficits and devaluations are all but guaranteed, and consequently so are long term silver price increases.
  7. Wars, political stupidity, monetary and fiscal madness, and central bank interventions all seem to be in “bull” markets. Expect silver prices to benefit from all the above.

Read: Watson: Market Tops in Gold and Silver

Spitznagel: When’s the Crash Happening?

Summary: Buy silver, sell the S&P, rig for stormy weather, and expect a turbulent 2016.

Silver thrives, paper dies!

Gary Christenson
The Deviant Investor

Temp Cover-FrontMy book “Who Killed Doctor Silver Cartwheel?” explores the reasons for silver demonetization and projects future prices for silver in five years. The book is a quick read and is priced at $6.99 in paperback on Amazon. Buy it!

The Catastrophic Threat of Bail-Ins

Published here: http://www.zerohedge.com/news/2015-12-29/catastrophic-threat-bail-ins


Hold your real assets outside of the banking system in a private international facility  -->  http://www.321gold.com/info/053015_sprott.html 


The Catastrophic Threat of Bail-Ins

Written by Jeff Nielson (CLICK FOR ORIGINAL)


The Catastrophic Threat of Bail-Ins - Jeff Nielson


It has now been more than two and a half years since the Cyprus Steal, the first “bail-in” perpetrated in the Western world, occurred. Before reviewing the history of this newest financial atrocity, it is necessary to define the terms.

The term “bail-in” describes a scenario in which a bank confiscates private property to indemnify itself for losses it has suffered. A bail-in is a totally lawless theft of assets, as there is no principle of law (of any kind) that could authorize such a seizure of private property. And in fact, there are many principles of law that demonstrate the lawlessness at work here. As with much of the financial crime jargon, “bail-in” is simply another gibberish euphemism like “quantitative easing” or “derivatives.”

As custodians of the financial assets of their clients, banks represent a form of trustee. The purpose of any trust relationship is to provide absolute security to the beneficiary of the trust (i.e., the legal owner of the property). Thus, one of the most fundamental principles of our legal system is non-encroachment regarding the property held in the custody of a trustee.

From a legal standpoint, it is like there is an invisible and impenetrable wall that surrounds the trust property. The only exceptions to this wall (ever) occur when the trust beneficiary makes a legal request for some disbursement or related transaction, when the trust itself directs some form of action (in the interests of the trust beneficiary), or when the trust allows the trustee to manage the trust assets on behalf of the beneficiary.

The idea of trustees using assets for their own benefit or (worse) claiming ownership of any trust assets represents one of the most serious forms of financial crime in Western civilization. Given this context, how did the government of Cyprus respond when its own Big Banks whined and claimed that they “needed” to confiscate deposits in order to pay off their own gambling debts? It meekly rubber-stamped the lawless theft.

How did other Western governments react to the violation of one of the most sacred legal principles in our entire financial system? They simply nodded their heads in unison, and, as a single chorus, called the Cyprus Steal “a precedent” – a template for future systemic financial crime in their own regimes.

Beyond the perfect choreography demonstrated by Western governments immediately after this act of theft, how do we know that the Cyprus Steal was a scripted event orchestrated by the Big Banks? To begin with, all of the Big Money deposit holders in Cyprus had already moved their money out of Cyprus banksbefore the Big Banks began their pillaging and plundering. The “fix” was in.

Not a single Western government raised the slightest qualm about violating one of the most sacred principles of law in our legal system. Rather, these puppet regimes went about creating their own “rules” as to how/when the Big Banks would be allowed to steal property from the accounts of their own account holders. The Harper regime entrenched “the bail-in” in Canada’s official budget, while other puppet regimes were sneakier and more circumspect when “legalizing” this crime.

Here it is necessary to back up and address the “reason” (excuse) behind this newest form of systemic bank crime. The “bail-in” is the ultra-insane culmination of the “too big to fail” doctrine. By this doctrine, any and all assets, public or private, in our financial system can and will be sacrificed (stolen by the Big Banks) to prevent any of the Big Banks from “failing” – that is, going bankrupt as a consequence of their ownreckless gambling.

The legal and economic principles violated by the concept of “too big to fail” are too numerous to list. However, they begin with the following objections:

        1) The concept of “too big to fail” is contrary to numerous tenets of capitalism. In any capitalist/free market system, insolvent entities are supposed to fail in order to correct the misallocation of assets. Any entity that grows to become an existential threat to the system is simply too big to exist.

        2) Banks should never be allowed to gamble. Period. There would have been no need for the $10’s of trillionsin “bail-outs” given to this crime syndicate following the Crash of ’08 if our puppet governments had not previously erased our laws that prevented such gambling.

        3) “Too big to fail” is based on an overtly criminal premise called systemic blackmail: “Give us everything we demand, or we’ll blow up the financial system.” It is extortion in perpetuity: financial slavery.

Note how (2) and (3) relate directly back to (1). Why shouldn’t banks gamble with their clients’ assets? Because by doing so they not only jeopardize the property they are holding in trust but also become a threat to the financial system. Why shouldn’t financial entities be allowed to grow so big they become an existential threat to the system? Because size (as we now see) gives these Big Banks the leveragenecessary to blackmail our corrupt, limp-wristed governments, perpetually.

So what is the only possible way to put an end to this Big Bank blackmail? Well, should our corrupt governments ever decide to once again enforce our anti-trust laws , we can end the cycle by smashing these Big Banks “down to size,” or down to the largest size allowed by law . Indeed, “too big to fail” is the ultimate example of why we need anti-trust laws and why they need to be vigorously enforced.

Anti-trust laws are anti-corruption laws. For decades, there has been almost no enforcement of our anti-corruption laws. The result is a global economy now almost totally dominated by just one of the major (and illegal) oligopolies that has emerged: the crime syndicate readers know as the One Bank.

It is this crime syndicate that engages in the systemic blackmail of “too big to fail,” supposedly to indemnify its Big Bank tentacles for the losses they incur. However, in almost every case, these “losses” are nothing but an accounting sham: paper losses owed by one Big Bank tentacle to another. No entity could ever be bankrupted by a “debt” owed to its right hand by its left.

The “losses” do not even exist, but the blackmail and fraud is all too real. Having totally depleted the public treasuries of most Western nations with its “bail-out” extortion following the Crash of ’08, the One Bank needed a new mechanism of theft by which to continue its permanent, institutionalized blackmail.

The bankers demanded that they be allowed to steal private assets (already in their custody), directly, any time they claimed to suffer a “substantial loss.” Our puppet governments, as usual, caved to the crime syndicate’s demands, and the “bail-in” was born.

What is at risk with a “bail-in?” According to the (perversely named) Financial Stability Boardany and every paper asset in the custody of the Big Banks and (potentially) any paper asset in the custody/control of our governments. The Financial Stability Board is one of the propaganda mouthpieces of the Big Bank crime syndicate, and its “guidelines” have been directly cited as authority by several of these puppet regimes, including the Canadian goverment.

How do people protect themselves from the massive bail-ins that are imminent as the Next Crashapproaches? There is only one way: get your assets (i.e., your wealth) out of all paper instruments. This includes the fraudulent paper currencies of our fiat-currency/ fractional-reserve Ponzi scheme system. Hold only enough wealth in paper instruments to satisfy current cash-flow requirements and short-term “emergencies.”

For the longer term financial Armageddon that is now inevitable, the only secure form of wealth-preservation is the oldest-and-surest tool for that task: precious metals. Rather than offering holders short- or medium-term protection for their wealth, gold and silver represent lifetime security, what people are supposed to have, and what most people still think they have when they entrust their wealth to a bank.


Once upon a time, we had strong, vigorously enforced laws that made a bank the safest place to store paper assets. That is no longer. Now banks are where your wealth is most likely to be stolen – and by the bank itself. Thanks to the bail-in, the term “bank robbery” now has an entirely different meaning.


Please email with any questions about this article or precious metals HERE


The Catastrophic Threat of Bail-Ins

Written by Jeff Nielson (CLICK FOR ORIGINAL)


Monday, December 28, 2015

Supply and Demand Report 27 Dec, 2015

Published here: http://www.zerohedge.com/news/2015-12-28/supply-and-demand-report-27-dec-2015

The prices of the metals rose a bit this quiet, holiday week. Merry Christmas!

Speaking of Christmas, Keith’s brother who is an amateur woodworker of growing skill, gave him this present on Friday.

clock

Regular readers may recognize the design as our logo. Each “M” is made of a single piece of wood. They are stained or painted in the correct colors. The minute hand is silver and the hour hand is gold (paint, alas!) It now occupies a prominent place in the office. :)

It is worth taking this time to review something that, based on some reader comments, may be the source of some confusion. The Monetary Metals fundamental price is measuring just that, the fundamentals. As with stocks or any other asset, our centrally banked, government-distorted markets can experience price volatility and even prices that deviate from the fundamentals for a long period of time. Just because we have been calculating a fundamental price for gold that is well over a hundred bucks above the market price, does not mean that the market price has to spike up $100 tomorrow morning. It might—and we certainly would not short gold when the market is in such a state. But as the market has proven since August, it might remain depressed for quite a while.

We have one other comment on this topic. For the longest time, we were calling for the silver price to drop sharply. It stubbornly did not, or when it did drop it would soon recover. We received some hate mail, and a lot more skepticism. In the end, it turned out that we were right and all the silver bulls were wrong. The silver price hit our lowest target, with a 13 handle.

We will continue to show our data, discuss our theory, and call ‘em like we see ‘em. Speaking of which, read on for the only true look at the fundamentals of gold and silver…

But first, here’s the graph of the metals’ prices.

              The Prices of Gold and Silver
prices

We are interested in the changing equilibrium created when some market participants are accumulating hoards and others are dishoarding. Of course, what makes it exciting is that speculators can (temporarily) exaggerate or fight against the trend. The speculators are often acting on rumors, technical analysis, or partial data about flows into or out of one corner of the market. That kind of information can’t tell them whether the globe, on net, is hoarding or dishoarding.

One could point out that gold does not, on net, go into or out of anything. Yes, that is true. But it can come out of hoards and into carry trades. That is what we study. The gold basis tells us about this dynamic.

Conventional techniques for analyzing supply and demand are inapplicable to gold and silver, because the monetary metals have such high inventories. In normal commodities, inventories divided by annual production (stocks to flows) can be measured in months. The world just does not keep much inventory in wheat or oil.

With gold and silver, stocks to flows is measured in decades. Every ounce of those massive stockpiles is potential supply. Everyone on the planet is potential demand. At the right price, and under the right conditions. Looking at incremental changes in mine output or electronic manufacturing is not helpful to predict the future prices of the metals. For an introduction and guide to our concepts and theory, click here.

Next, this is a graph of the gold price measured in silver, otherwise known as the gold to silver ratio. The ratio fell this week. 

The Ratio of the Gold Price to the Silver Price
ratio

For each metal, we will look at a graph of the basis and cobasis overlaid with the price of the dollar in terms of the respective metal. It will make it easier to provide brief commentary. The dollar will be represented in green, the basis in blue and cobasis in red.

Here is the gold graph.

              The Gold Basis and Cobasis and the Dollar Price
gold

The cobasis (i.e. scarcity of gold) and price of the dollar (which is inverse of the price of gold, measured in dollars) continue their uncanny tracking. We say that these price moves are unimportant.

Obviously—this should go without saying—it’s very important to anyone who has made a bet on the gold price. That’s not what we mean.

We are saying that nothing fundamental changed. If the price went up—as it did this week—then it was speculators buying to front-run a larger price move that they hope is coming. If the price fell, as it did in other weeks, it was speculators selling. These waves of speculative buying and selling do not generally change the fundamentals of the market.

Now let’s look at silver.

The Silver Basis and Cobasis and the Dollar Price
silver

As the dollar dropped in silver terms, so did the scarcity of silver. The scarcity dropped a bit faster, and now the backwardation has faded away. On Thursday, at $14.35, silver is no longer really scarce. We would not call it abundant, nor scarce.

The fundamental price of silver fell a few cents this week. It’s now basically at market.


© 2015 Monetary Metals

Sunday, December 27, 2015

Hey Goldman, Tell Us, Are These Countries Really That Stupid To Buy Gold?

Published here: http://www.zerohedge.com/news/2015-12-28/hey-goldman-tell-us-are-these-countries-really-stupid-buy-gold

China economic growth

We’re nearing the end of this year, and that’s when the major banks come out with their Christmas shopping lists. And of course as you could have expected, not a single decent bank is even considering to add gold to the list, and the bearish voices are now stronger than ever before.

Russia China Gold 3

Source: birchgold.com

Goldman Sachs expects the price of the yellow metal to fall to $1000/oz whilst the Bank of America, BNP Paribas and ABN Amro all expect the gold price to fall below the $1000-level in 2016. That reminds us of the exact opposite stance just a few years ago when gold was skyrocketing. Back then everybody was saying the yellow metal was a very useful addition to a portfolio and even the common man in the street was considering buying gold.

And of course, that has proven to be a good counter-indicator. The more gold is liked/hated by the common man, the higher the chance is its price will undergo a correction/put a bottom in place. And that might be exactly what we are seeing here at the $1080-1060-level. The gold price has tested this theoretical and technical bottom a few times but has repeatedly failed to fall towards a triple-digit number and always bounced slightly. Of course, that’s not a good enough reason to run out and increase your exposure to gold as we’re obviously not out of the woods just yet, but there’s a bigger picture we’d like to present here.

Russia China Gold 2

Source: silverdoctors.com

We all know the non-conventional countries are still keen on getting their hands on even more gold, and when the gold price falls, these countries are actually stepping up their buying pace. Russia, for instance, has purchased 5.27 million ounces in the first ten months of this year and will very likely end 2015 with a 6M oz higher gold position compared to the end of 2014. That by itself already is a very interesting and important fact as it shows that even when the Russian economy is falling apart it still considers gold to be a very important part of its strategic reserves. The next chart shows you how gold as a percentage of Russia’s official foreign assets has evolved.

Russia China Gold

And Russia obviously isn’t alone. Its friends in Kazakhstan have increased their gold holdings by 13% YTD and gold now accounts for 28% of the total amount of official reserve assets.

China Gold Import

Source: bullionstar.com

China also continues to buy more gold and is believed to have purchased no less than 35 tonnes of physical gold in just October and November alone, increasing the official stash by 1.1 million ounces in just two months. In fact, when the gold price was correcting in November, China stepped up its buying rate by a stunning 40%, and we wouldn’t be surprised to see the country having imported an additional 20-25 tonnes of gold in December.

And no, it’s not just Russia & friends and China that are buying gold, but India has also confirmed it expects to import 1,000 tonnes of gold this year, roughly 100 tonnes more than originally anticipated as the jewelers are stepping up the plate to take advantage of the current low price.

All of this leads us to one question. Please, Goldman Sachs, BNP Paribas, JP Morgan and other Bank of Americas, please tell us why these countries are so keen to destroy their own wealth? There’s no fundamental reason why the gold price should go further south and the country with probably the best long-term vision (China, which is also stockpiling as much oil as its strategic reserve tanks can hold) is filling the basement of its Central Bank with newly-smelted shiny bars.

>>> Protect Your Wealth: Download our Exclusive Gold Report

Secular Investor offers a fresh look at investing. We analyze long lasting cycles, coupled with a collection of strategic investments and concrete tips for different types of assets. The methods and strategies are transformed into the Gold & Silver Report and the Commodity Report.

Follow us on Facebook @SecularInvestor [NEW] and Twitter @SecularInvest

Thursday, December 24, 2015

1 Surprising Reason to Be Bullish on Silver Prices

Published here: http://www.profitconfidential.com/silver/1-surprising-reason-to-be-bullish-on-silver-prices/

Strong Demand Bullish for Silver Prices
The silver prices outlook for 2016 looks great. The gray precious metal remains severely undervalued and could see a massive move to the upside in the New Year.

To see where silver prices are going next, investors should be looking at the most basic fundamentals of the silver market: supply and demand. To read about where the supply side is headed, see “Precious Metals: Silver Prices Poised to Skyrocket in.

The post 1 Surprising Reason to Be Bullish on Silver Prices appeared first on Profit Confidential.

Wednesday, December 23, 2015

Silver Rides a Runaway Expense Train

Published here: http://goldsilverworlds.com/gold-silver-experts/silver-rides-a-runaway-expense-train/

The US government will spend nearly $4 Trillion this fiscal year – starting last October 1. Of course it projects a massive deficit, increasing national debt, uses “funny” accounting, and does not address unfunded liabilities.

Business as usual…

Examine the last 100 years of US government expenditures and national debt – on a log scale in $ millions. Note that official government expenses have increased from about $750 million to about $4 Trillion, an increase by a factor of over 5,000.

R-nd_exp

National Debt (official – not including unfunded liabilities) has increased from about $3 billion to nearly $19 Trillion in 100 years, an increase by a factor of about 6,000.

Expenses increase, national debt increases more rapidly and … based on 100+ years of history, both will continue their exponential increases for a long time. The 100 year exponential increase in government expenses has averaged about 8.9% per year.

The Excel calculated statistical correlation between US government expenses and official national debt for 100 years from 1915 – 2015 is 0.97. No surprise here.

What about silver prices?

Silver in 1915 averaged about $0.56 cents per ounce, per Kitco.com. Since then national debt increased, the dollar was continuously devalued, and silver prices increased. Business as usual … the train runs down the track.

The Excel calculated statistical correlation between US government expenses and silver prices for 100 years is 0.82. The government spends more, goes deeper into debt, the dollar devalues, and silver prices rise. Business as usual … train running down those tracks …

But if we look at the ratio of silver prices to the official expenses of the US government over the past 30 years, we see a reversal in the years around 2000 – 2003. Call the turning point September 11, 2001.

R-sind-30yr

From 1985 to 2001 the (1 trillion times) silver/expenses ratio declined as the paper (stocks, bonds and debt) economy boomed, commodity prices, including silver and gold, languished, and the ratio dropped from about six to two. But after 2001 the ratio climbed to a high of nearly 10 in 2011, and has since dropped to about four.

IT IS CLEAR THAT:

  1. Expenses and national debt are exponentially increasing with no end in sight.
  2. Both expenses and national debt resemble a runaway train without the oversight of adult management.
  3. Silver is used and needed in more industrial applications every day.
  4. Investor demand for silver is much larger than in previous years and increasing.
  5. Supply appears to have peaked. Read Steve St. Angelo’s comments.
  6. Silver prices, even as erratic as they are, correlate with US government expenses over 100 years at better than 0.80. Expenses will increase and so will silver prices. Silver prices are riding that accelerating expense train.
  7. Silver prices have corrected about 70% from their 2011 high and, based on history, will “regress to the mean,” which means their next big move should be much higher.
  8. War, further dollar devaluation, an increase in monetary or fiscal stupidity, a financial crash, or a weakening of US international prestige will accelerate the decline of the dollar and the rise of silver prices. All of the above seem likely. Read Bill Holter.

I think it is clear that silver prices will rise considerably. The expense train is accelerating and the consequences will push silver prices higher.

Assume US government expenses increase by a typical 40% – 50% in five to seven years and the silver to government expenses ratio increases from the current 4 to about 12 or considerably higher. That puts silver prices in the range of $50 to $100 around 2020 – 2022.

Is $100 silver improbable? Consider for comparison:

  1. Silver prices rose from under $2 in 1973 to about $50 in January of 1980.
  2. Apple computer stock rose from under $0.50 (split adjusted) in 1997 to over $125 in 2015.
  3. Argentina has devalued the peso in the last 40 years by a factor of about 1,000,000,000. Inflation (excessive central bank “printing”) is aggressively destroying currencies in many countries throughout the world.
  4. The Federal Reserve was “printing” about $85 Billion per month to buy dodgy paper to bail out banks. Approximately two months of such QE was enough to purchase all the gold that supposedly is stored in Fort Knox. It is easy to “print” currency but it is difficult to create wealth. Yes, gold is wealth! If not, why does Fort Knox exist and why are China and Russia aggressively selling paper and importing gold?

I think $50 – $100 silver is not only possible but quite probable within a few years. It certainly seems likely by comparison to the above four actual events. Yes, silver prices are riding the runaway expense train.

Silver thrives, paper dies!

Gary Christenson

The Deviant Investor

This book discusses future silver prices, demonetization of silver, central bank policies, the Vietnam war and other topics in the context of a detective story. Available at Amazon.

MERRY CHRISTMAS: Be A Pig And Make It Big... With Commodities!

Published here: http://www.zerohedge.com/news/2015-12-23/merry-christmas-be-pig-and-make-it-big-commodities

commodities_header

The pork cycle is to economics what the law of gravity is to physics. You can count on it. Every single time. The only thing that makes economics the trickier science, is timing. Because you never know when the market hits peak or bottom. But economics is not an exact science. Investors don't need to get the cycle exactly right to make money. About right cuts it.

The key to understanding the broad commodity cycle, which functions just like the pork cycle, is the time lag between the investment decision and the creation of new supply. What would happen in case there wouldn't be a time lag? An uptick in demand causes a price increase. The price increase causes additional investment. And the surplus demand would immediately be filled by new supply. Same thing on the downside: demand drops, price drops, investment falls, and production would be cut instantaneously. Our hypothetical result: steady prices.

Of course, reality is different. Breeding the hog takes time. When the price of oil or copper rises, companies can probably squeeze out some extra output. But to substantially increase production to fill the new demand, they need to increase exploration budgets. That means hiring new geologists, given that companies probably fired those when prices were low - if they are still around. The geologists need time to search for the treasure. When they find something, engineers need time to figure out how to drill the well or build the mine. Permits need to be arranged. The company might also need to raise capital. And only then, construction would commence.

By the time the whole new enterprise is up and running, demand starts to drop. Due to the price mechanism, users increased efficiency or switched to substitutes. Or a recession hits. At that point, the commodity producers will be holding the bag. And anyone who invested in commodities lately will know exactly what that means.

crb_index_commodities_1

Our current cycle started in December 2001, when China joined the WTO. That event marked the beginning of the greatest commodity boom the world ever witnessed. The hungry Chinese giant craved commodities. Commodity producers were throwing everything at it, but it never seemed saturated. Then the global financial crisis hit in 2008. After a commodity collapse, prices bounced quickly and forcefully. This strengthened the China hypothesis even further. We were now in a new era.

Except we were not, of course. Multi-billion dollar mines with long lead times came online just as China started slowing down. The law of gravity took commodity prices down to levels not seen since 1974. Continuing our science metaphor, we are witnessing Newton's Third Law applied to economics: the large upward force caused a force equal in magnitude, but opposite in direction. After the Great Boom, we're now in the Great Collapse.

There even seems to be another new paradigm, which is sort of the mirror image of the boom: China switches its economy from industry to services. With the flip of a switch, every factory worker becomes an app developer. Nobody needs stuff anymore, as everything is now 'in the cloud'. China's pace of growth will continue to fall. Commodity prices will extend their tailspin.

Well, maybe the pundits are right. We don't have a crystal ball. But just allow us to add some balancing facts to the China discussion. China is ramping up government spending, just as it did after the financial crisis.

commodities_china

It has also just opened a whole new local government bond market:

commodities_china1

We're not sure how this will end, but the business cycle is also a cycle. China has been slowing down for four years already. No matter what, these measures will provide additional Chinese demand.

Now, more importantly, back to the commodity supply side. The table below shows an extract from a recent Americas Metals & Mining report by Deutsche Bank. Commodity producers are cutting their CAPEX in a huge way. Globally, we see the same picture across the board. That's your pork cycle at work right there. We are once again setting ourselves up for future commodity shortages.

commodities_DB

What will cause commodity prices to turn? Well, increased demand and reduced supply of course - nothing new here. But the specifics will be hard to predict. For example, in 2011, nobody was yet aware of fracking. We now know this new technology turned the oil market upside down. There will probably again be some factor we're currently not expecting. An example could be rapidly accelerating growth in India, which is now where China was decades ago. China has 1.36 billion inhabitants. India has 1.25 billion.

It's just a guess. But the commodity cycle will turn. We will know what made it turn only after the fact. But that's not even relevant to you as a shrewd investor. The only thing that matters is that you need to act now if you're serious about making serious money. And gradually expand your exposure to commodities. As the legendary trader Stan Druckenmiller noted:

"The first thing I heard when I got in the business....was bulls make money, bears make money, and pigs get slaughtered. I'm here to tell you I was a pig. And I strongly believe the only way to make long-term returns in our business that are superior is by being a pig."

Secular Investor offers a fresh look at investing. We analyze long lasting cycles, coupled with a collection of strategic investments and concrete tips for different types of assets. The methods and strategies are transformed into the Gold & Silver Report and the Commodity Report.

Follow us on Facebook @SecularInvestor [NEW] and Twitter @SecularInvest

IMPORTANT SILVER KEY FACTORS: 3 Must See Charts

Published here: http://www.zerohedge.com/news/2015-12-23/important-silver-key-factors-3-must-see-charts

DEC


.

Hold your real assets outside of the banking system in a private international facility  -->  http://www.321gold.com/info/053015_sprott.html 


IMPORTANT SILVER KEY FACTORS: 3 Must-See Charts

Posted with permission and written by Steve St. Angelo, SRSrocco Report (CLICK FOR ORIGINAL)


The silver market has experienced serious changes which precious metal investors need to be aware. Unfortunately, there is a shortage of information and data to provide investors with important key factors going forward. To understand the silver cost-price dynamics, investors need to see the following three charts below.

I did an interview with Jason Burack from Wall Street for Main Street a few days ago (to be published shortly) on the future value of precious metals. My analysis looks at how energy will be the driving force in pushing the value of gold and silver to substantially higher levels.

When I wrote the article Gold & Silver Prices To Surge On Fundamentals, Not Technical Analysis, many readers who made comments assumed the lower price of oil would guarantee lower precious metal prices for quite some time. While this sounds logical at face value, I believe the opposite is the case.

Before I get into why I believe the value of silver will surge in the future, let’s look at some silver price vs cost fundamentals.

The Price Of Silver vs The Price Of A Barrel Of Oil

The price of silver has moved in tandem with the price of a barrel of oil for nearly 100+ years. Here is a chart showing the change in the price of oil and silver since 2000:

As we can see in the chart, as the price of oil moved up higher, so did the price of silver. Some technical analysts may see this as merely a coincidence…. it’s not. Energy is the key factor that drives the value of most assets. This is not up for debate, even though many individuals will continue wasting their time trying to prove otherwise.

Now, the important thing to see in this first chart is the relationship between the silver price and oil price today versus what it was the last time oil traded at that level. To do that, we have to go all the way back until 2004 when a barrel of Brent Crude was trading the same as it is today.

The current price of Brent Crude is $39.65 and the price of silver is $14.11. However, when the price of Brent Crude was $38.26 in 2004, the price of silver was less than half at $6.67. This may give silver investors a lousy feeling as this past relationship portends for a much lower silver price.

Don’t worry, the fundamentals show that the present silver market structure is much different from it was just a decade ago.

Silver Mining Yields & Costs Head In Opposite Directions

Several of my readers have sent me emails worried that the lower price of oil will translate into much lower silver prices. While this sounds like common sense, there are several factors that reveal a much different picture.

One aspect of the silver market that isn’t discussed in detail by the precious metal community is the huge decline in average yield by the primary silver mining industry. I believe I am one of the only analysts that have published charts showing the decline in average yield in the top silver producers.

From 2005 to 2013 the average yield from the top six silver companies (including one primary silver mine) fell from 13 ounces per tonne (oz/t) to 7.6 oz/t. This was a 42% decline in average yield in just eight years. However, this downward trend reversed in 2014 as Tahoe Resources brought on its new super high-grade Escobal Mine in Guatemala. In 2014, Tahoe Resources Escobal Mine average yield was a staggering 16 oz/t.

What is interesting, by adding the this super high-grade Escobal Mine to the group, it only pushed up the group’s average yield to 7.8 oz/t. Moreover, if we look at the data for 2015 year to date (Q1-Q3), the average yield is heading lower once again. One of the reasons the group’s average silver yield declined to 7.4 oz/t this year was due to the large fall in Tahoe Resources Escobal Mine’s average yield. It fell from 16 oz/t in 2014 to 13 oz/t for the first three-quarters of 2015.

Some analysts are saying the primary silver miners have been high-grading their mines in order to stay profitable. While this may be true for several mines in some of the companies, this is not the trend for the entire primary silver mining industry. If it was, we would have seen an increase in the average yield in 2015, not a decline.

Investors need to realize the primary silver mining industry is processing almost double the amount of ore to produce the same or even less silver than it was just a decade ago. You don’t have to take my word for it, here is the data:

Top 7 Primary Silver Miners Total Processed Ore

2005 = 9,444,000 metric tons

2014 = 17,776,000 metric tons

While it’s not quite double, it’s close. This huge increase in processed ore has a profound impact on the cost to produce silver. To get a better idea of how it impacts the primary silver mining industry’s bottom line, let’s look at one of the largest silver producers in the world.

Pan American Silver: Evidence Of Rising Costs

If we look at one of the largest primary silver mining companies in the world, we can see just how much higher costs are today compared to a decade ago. This chart shows the average annual price Pan American Silver received for silver (White line), the estimated break-even (Light blue area) and the estimated silver income per ounce (Green or Red). The green color denotes a profit while red represents a loss:

The realized silver price Pan American received that year was close to the average market price (Note:some older years, the realized price was not stated in the Annual Report so, I used the average market price). According to my estimated break-even calculations, Pan American lost an estimated 10 cents an ounce in 2004, this turned positive for years 2007-2012 and then fell negative for the past three years.

The estimated silver profit per ounce for Pan American Silver peaked in 2011 at $9.02 an ounce. Now, what is interesting about this chart is the cost and market price ratio since 2004. I did not include 2005 or 2006, because the chart was originally designed from years 2007-2014. I plan on adding years all the way back until 2000, but that will be in an upcoming Report.

Regardless, Pan American Silver lost 10 cents an ounce in 2004 when the average market price for silver was $6.67. Thus, Pan American Silver needed to receive $6.77 to break-even. This was during the year when the price of a barrel of Brent Crude was $38. Now, if we look at Pan American Silver’s results for the first nine months of 2015, they received an average of $15.85 for silver, but lost 97 cents for each ounce produced.

Which means, Pan American Silver needed to received $16.82 for the first nine months of 2015 to break-even. Again, this is according to my “Estimated Break-Even Analysis” based on using Adjusted Income. For Example, Pan American Silver reported a $19 million net income profit in 2004, but this was due to a sale of a property (asset) in the amount of $23.7 million. The net income gain that year was not the result of profitable silver mining, but rather due to the sale of a property.

This is the reason I use the Adjusted Income approach in determining a more realistic cost to produce silver.

Even though Pan American Silver has been able to lower their break-even by extensive cost cutting and lower energy prices, we can see they still lost 97 cents an ounce at a realized price of $15.85 in 2015 versus losing 10 cents an ounce in 2004 when the market price of silver was $6.67.

Pan American Estimated Break Even:

2004 = $6.77

2015 Ytd = $16.82

Now, if the price of oil continues to fall, the primary silver mining industry could see additional declines in their overall cost to produce the metal. That being said, I don’t see a huge drop in overall costs for the primary mining industry going forward. This is due to generally higher inflation and falling yields. It just cost a lot more today to produce silver than it did a decade ago… even with the same oil price.

While it’s true that Pan American Silver is only one company, the overall cost structure is about the same for the entire industry. Thus, a lower oil price will not translate into the same corresponding silver market price we had in 2004.

The silver market and industry are experiencing serious changes, and it’s only a matter of time before investors realize it is one of the most undervalued assets in the world.

Silver Commodity Pricing vs A Store Of Value Asset

The one important factor investors need to understand about silver is the difference between “Commodity Pricing” and “Store Of Value Asset.” Currently, silver and gold are being valued as a commodity. This is based upon cost of production including supply and demand forces. If the industry cost to produce gold was $500, the current market price would be much lower.

However, the cost to mine gold is close to its market price. This is the same for silver. We can see this in the Pan American Silver break-even price. Of course, supply and demand play a part, but these forces are artificially manipulated due to the massive siphoning of investors funds into financial paper products (some call them assets… they are not) over the past several decades.

Because the current price to produce silver for the primary mining industry is close the current market price, investors do not understand why precious metal analysts continue to say that silver is severely undervalued.

IMPORTANT FACTOR:Silver is not undervalued due to its present primary silver mining production cost, but rather due to its misunderstood store of value principles compared to most financial paper assets under management.

As the world’s Great Financial Ponzi Scheme disintegrates under the weight of collapsing U.S. and global oil production, investors will move into hard assets such as gold and silver to protect wealth. We are already witnessing the beginning stages of this.

Investors have kept their money in bank accounts to earn interest. However, as interest rates have fallen to zero and soon negative, there is no motivation for investors to keep funds in these accounts. Matter-a-fact, the notion that gold and silver don’t earn a yield may no longer be a concern to the wealthy who just want to protect their wealth from the possibility of bank bail-ins or etc.

In addition, we are seeing more and more companies reduce or totally remove their stock dividend payouts. Investors who may have been worried about stock market valuations, have kept the shares because they continue to receive dividend payouts. What happens when the majority of stock dividends totally evaporate?

The world is entering into a terminal phase in which it’s unprepared. There will be very few assets to protect wealth in the future. Gold and silver happen to be two of the most safest and proven stores of value for over 2,000 years.


Please email with any questions about this article or precious metals HERE


IMPORTANT SILVER KEY FACTORS: 3 Must-See Charts

Posted with permission and written by Steve St. Angelo, SRSrocco Report (CLICK FOR ORIGINAL)


Independent researcher Steve St. Angelo (SRSrocco) started to invest in precious metals in 2002. Later on in 2008, he began researching areas of the gold and silver market that, curiously, the majority of the precious metal analyst community have left unexplored. These areas include how energy and the falling EROI – Energy Returned On Invested – stand to impact the mining industry, precious metals, paper assets, and the overall economy.

You can find many of Steve’s articles on many noteworthy sites. Visit Steve athttps://srsroccoreport.com.