Published here: http://www.zerohedge.com/news/2017-10-31/stumbling-uk-economy-shows-importance-gold
Stumbling UK Economy Shows Importance of Gold
- UK economy outlook bleak amid Brexit, debt woes and rising inflation
- Confidence in UK housing market at five-year low
- UK high street sales crash at fastest rate since 2009
- Number registering as insolvent in England and Wales hit a five-year high in Q3
- UK public finance hole of almost £20bn in the public finances set to grow to £36bn by 2021-22
- Protect your savings with gold in the face of increased financial woes in UK

This week markets will be watching the UK with baited breath as the Monetary Policy Committee meets this Thursday to discuss a potential rate rise.
Expectations of a rise have increased to 80% in the last week. If the Bank of England does raise rates it will be for the first time in a decade. It is unlikely to be a dramatic increase though, probably a rise of 25 basis points to reverse the emergency rate cut which followed the Brexit vote.
Should the UK decide to raise rates this will likely boost confidence somewhat in the economy. However any increase in positivity regarding the UK will be short lived once markets realise it will take more than a small rate rise to get the country out of the huge red hole it is currently digging its way into.
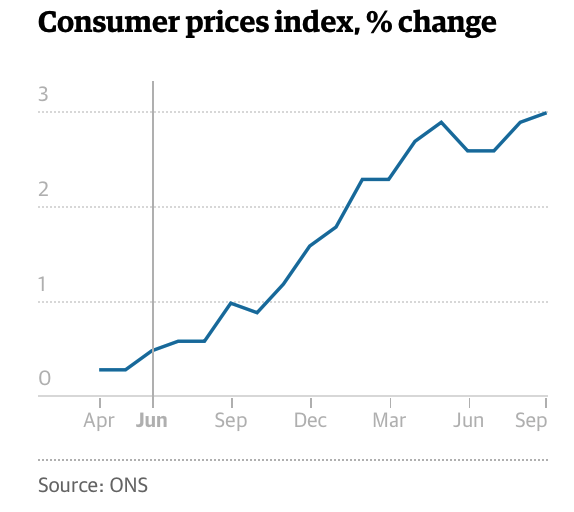
Brexit is being blamed for the majority of the UK's woes at present, however this is merely a politician's scapegoat. Confidence in the UK housing market has slipped to its lowest level in five years, family spending power has declined in five out of the last six months, the hole in public finances is likely to increase over 100% from the initial forecast by 2020, personal insolvencies are at a five year high and inflation has hit 3%.
These plus many more financial and economic problems have long been brewing. Problems with money naturally lead to social problems which end up exacerbating themselves further as individuals find continue to struggle on a daily basis.
Sadly the UK is in a real state of limbo thanks to Brexit, how the government will manage to solve the other significant issues such as rising debt levels (public and private), inflation and a slowing economy whilst managing EU negotiations is a feat yet to be witnessed.
We have been approaching a juncture for some time where we must decide as individual savers, investors, pensioners and future pensioners what the best way to prepare for the future is. Do we stand back and believe that the government has our best interests at heart or do we prepare for their failure? Their inability to support the value of the pound, protect interest rates, avoid bank bail-ins and solve the debt crisis are all situations that could see our own savings put at real risk.
Falling confidence both in and inside the UK
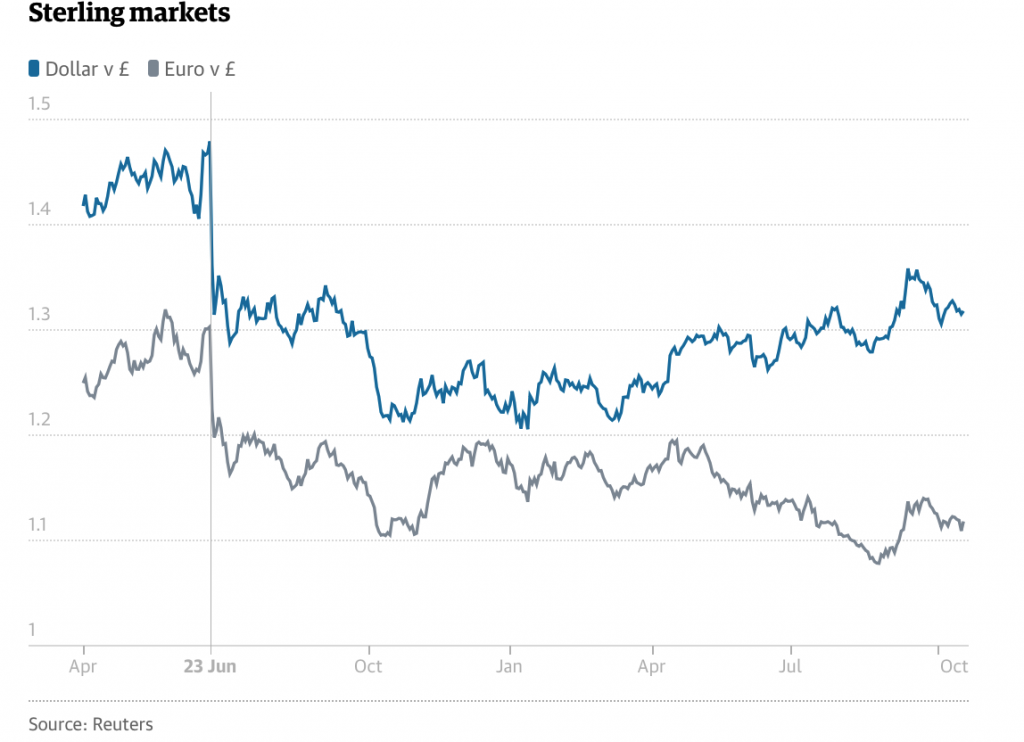
Despite expectations of a rate rise, sterling stumbled in October thanks to weak economic data and more negative headlines regarding Brexit.
What's the one thing governments like to say positively about a weak currency? That it's good for exports...but not in the UK it's not.
As we explained earlier this month, a much revered boost to UK exports following the Brexit vote was most likely down to our gold market. Now that the Chinese have calmed down on their gold shopping spree we are seeing what state the rest of the export market is really in.
The Guardian explains:
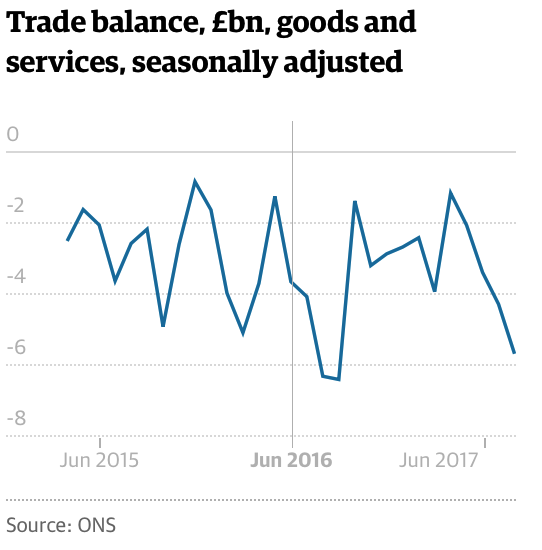
The trade deficit in goods hit a record high, as the gap between what the UK bought and sold widened in August to £14.2bn. That was much bigger than expected, and up from £12.8bn in July. Imports surged by 4.2% during the month, while exports only rose by 0.7%. The overall trade deficit, including services, widened to £5.6bn in August from £4.2bn in July.
...and from within things aren't much better
Currency and export markets are not the only ones having a problem with the UK. There are nervous feelings much closer to home - in people's own homes and on the high street.
A Halifax bank survey found one in five British adults surveyed expect house prices to fall over the next 12 months. This is the weakest reading for consumer expectations since October 2012.
This negativity regarding the housing market is thanks to concerns over the economy, weak wage growth and concerns over rising inflation. For years the UK government has rallied around the UK housing market, convincing citizens that owning a home was a right of passage. It seems the jig is up.
Most new buyers are losing faith in the housing market as not only is the cost of borrowing set to raise but raising the funds for a deposit is near impossible. In the three months to August there was negative wage growth, bringing the total number of months of negative growth to six for 2017, alone.
In all regions of the UK incomes have failed to rise by more than the current inflation rate of 3%. This is not only placing pressure on the housing market but also on consumer spending.
A 'steep drop' in retail sales was reported in the CBI survey this month, alongside orders placed with suppliers dropping at their fastest rate since the spring of 2009.
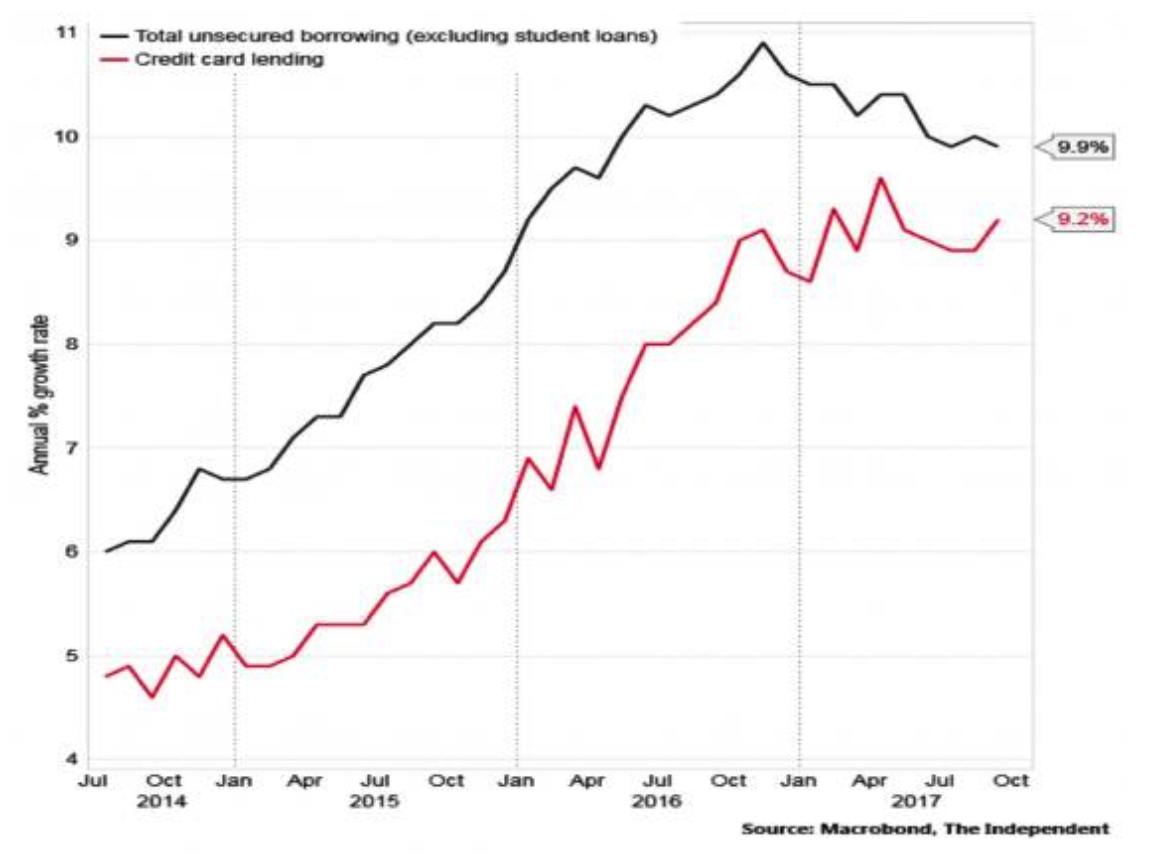
But people still need to eat, clothe themselves, keep a roof over their families' heads and this is where the government has gone so badly wrong. By fuelling an era of cheap credit, stealthflation, zero-hour contracts and low wage growth families and individuals no longer know how to survive on their wage packets.
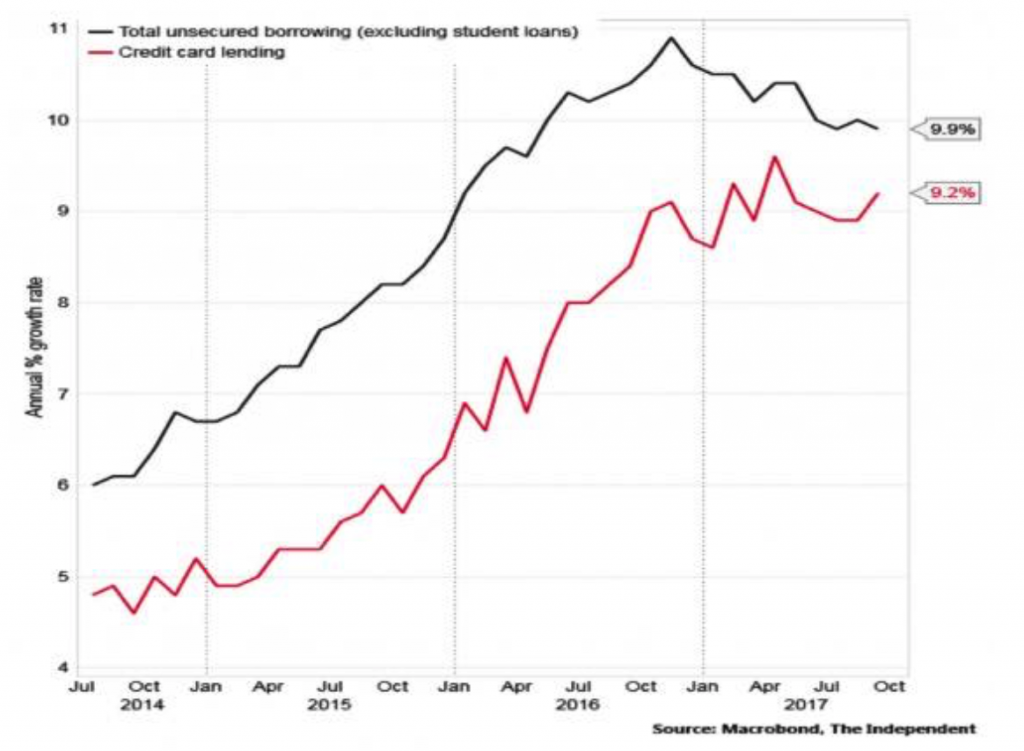
The annual rate of growth of consumer credit climbed is currently at 9.9%, having been as high as 10% in the summer.
According to Bank of England data, another £641m was put onto plastic in the month of September, the sharpest increase in debt since May 2016. The total credit card debt stock reached £69.4bn, the highest on record.
Unsurprisingly, this isn't sustainable. The number of people registering as insolvent in England and Wales hit a five-year high in the third quarter
The number of those registering as insolvent is only set to get worse should interest rates rise. A hike would push up the cost of both secured and unsecured borrowing.
As Gillian Guy, the chief executive of Citizens Advice, told the Independent:
“The rise and rise of consumer debt is a cause for alarm at a time when large numbers of people are already in financial difficulty."
Broken government = broken economy
Of course, very little of the 'on the ground' problems such as wage growth and consumer debt levels are making the headlines.
The headlines are the same as they have been for the last 18 months or so: BREXIT DISASTER.
Is it a disaster? Who knows, but what we do know is that it is costing a huge amount of money with even more expected to be paid out in the coming years. This is all money that the UK simply does not have.
It was only a fortnight ago that we found out Britain’s stock of wealth had fallen from a surplus of of £469 billion to a net deficit of £22 billion. This is down to a massive write-down of the UK’s assets and a drop in foreign direct investment (again, a lack of confidence in the UK).
Meanwhile the gap between government spending and tax receipts is also expected to 'outperform' expectations. The Institute for Fiscal Studies (IFS) expects it to reach £36bn by 2021-22, more than twice the initial official forecast of £17bn.
On the issue the IFS said:
“It is hard to see how the chancellor can both maintain the credibility of his fiscal targets and respond effectively to the growing demands for spending”
Quite. The outlook is not good. Productivity is expected to decline in the UK as the majority of jobs being created are low-skilled, low-wage jobs created for those in need. How this helps the UK tax receipts? It doesn't.
The Office for Budget Responsibility (OBR) has said the UK government will need to significantly lower its estimates for the economic output per hour worked in Britain. In a massive miscalculation admission it states that it views the 0.2% rate of productivity growth over the past five years as a better guide for 2017 than its forecast of 1.6% in March.
EU, it holds the first charge

Not only does the UK government not have the income to sort out its deficit or increase spending but the EU is coming after us for more money.
No one quite knows just yet what the 'divorce bill' will be, but more worryingly it looks like we can't get back the money we placed in a bank we own 16% of.
According to Alexander Stubb (vice president of the European Investment Bank) the UK may have to wait 30 years to get its £3bn back from the EU’s bank after Brexit and could be on the hook for £30billion if “things go sour”.
As bad as this sounds, can we at least enjoy the hint of irony in this situation. A UK government that has done very little to support customers from the tyranny of British banks, supported bail-outs and pushed for bail-ins is now facing its own problems getting back its money from a bank.
UK savers need to start learning from the mistakes of their leaders.
Conclusion: prepare for the long-term
The 2008/09 financial crisis was not the first economic disaster to hit the United Kingdom. Consider the Wall Street crash on 1929. It very quickly affected this small island nation, causing the economy to shrink by more than 5% and unemployment to spiral to 17%. All in just three years.
Today we find ourselves on arguably scarier ground. Despite lower unemployment, it is an increasingly unproductive labour force with which we find ourselves. It's nine years ago that the last financial crisis started and the economy has rebounded by less than 10% - a far slower pace than after the Great Depression.
The difference? In the 20th century the government put in place policies that worked for the long-term health of the economy. Today, governments are not looking at anything other than day-to-day results. They no longer prepare for the long-term health of the economy.
They are looking at Brexit and how to boost confidence in the UK. They have no idea how to do anymore, Brexit has got their knickers in a twist. This is unlikely to help struggling savers and consumers in the meantime.
Very often plans that result in positive outcomes a few years down the line aren't good for an election just a couple of years away. This means that we live in a five-year cycle of economic policies, budgets and grand plans.
Unfortunately this leaves savers and investors fending for themselves when it comes to planning their long-term finances. This is made more complex by the increasingly uncertain times in which politicians and central bankers are inevitably navigating us towards.
With this in mind we need to take our finances into our own hands. As we explained last week, we must prepare. Failure to prepare is preparing to fail.
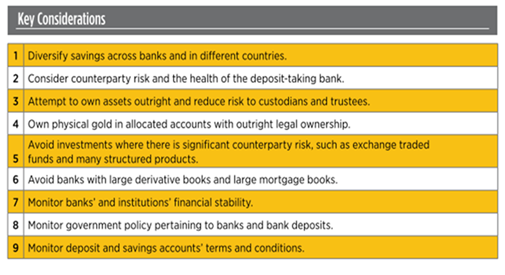
Investors should protect themselves from the financial risks of the UK government by diversifying their savings and owning physical gold -not paper or digital gold.
Physical gold that is allocated and segregated cannot fall victim to bail-ins when the government is short of cash or inflation when the central ban needs to print more money.
Physical gold in your portfolio reduces the level of counterparty risk your savings are exposed to and ensures some level of sovereignty and financial safety and freedom when it comes to your wealth.
These financial risks including bail-ins are a threat to all savers in the western world.
News and Commentary
Small Caps Routed as U.S. Stocks Fall, Bonds Rise (Bloomberg.com)
Gold price rises 3.2% in Q3 (MiningWeekly.com)
Gold notches a gain for a second day as strong dollar pauses its climb (MarketWatch.com)
Gold steadies ahead of bumper week for central bank news (Reuters.com)
Trump likely to pick Jerome Powell as next Fed chair: source (Reuters.com)
 Credit: Wall Street Journal
This Could Be Huge: Gold Bar Certified By Royal Canadian Mint Exposed As Fake (ZeroHedge.com)
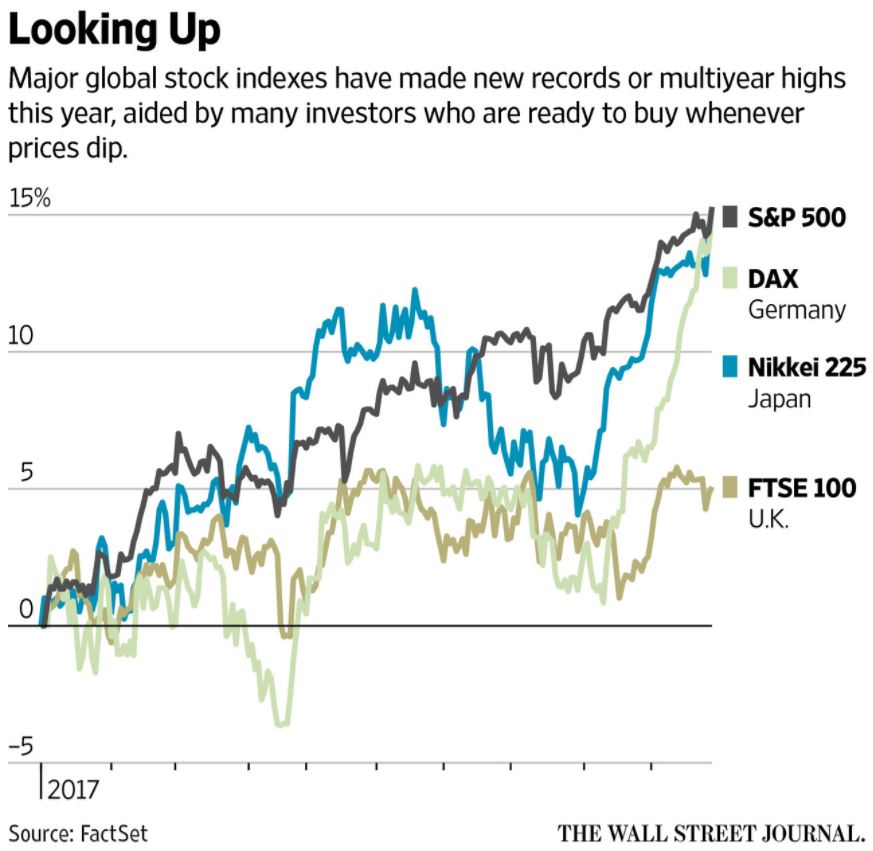
Why Are Markets Rising Everywhere? Investors Can’t Stop Buying Every Dip (WSJ.com)
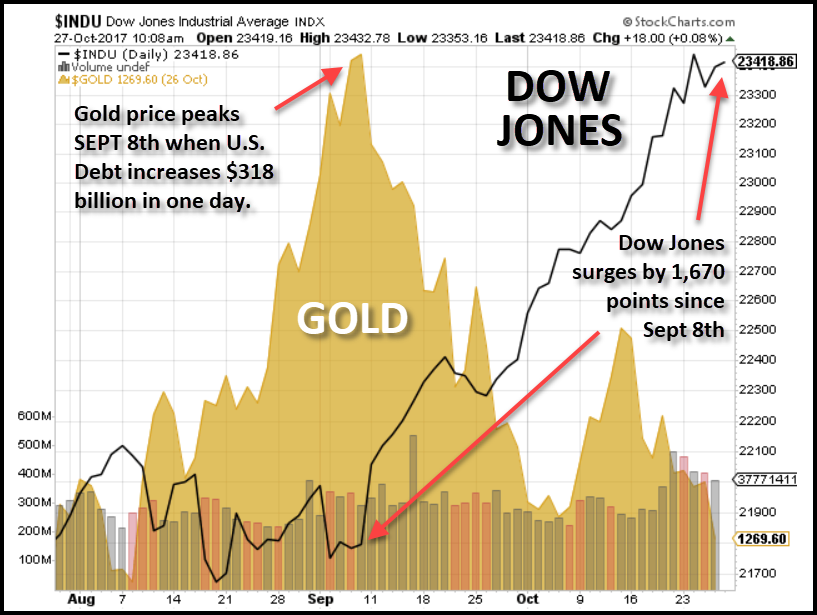
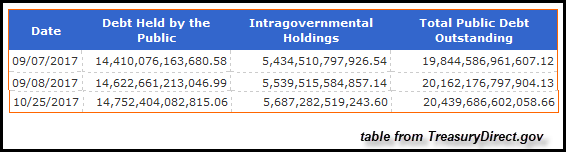
The US government quietly added $200+ billion to the debt this month alone. (SovereignMan.com)
Are ICOs Replacing IPOs? (USFunds.com)
The economy is failing. We need to think radically about how to fix it (TheGuardian.com)
Gold Prices (LBMA AM)
31 Oct: USD 1,274.40, GBP 964.21 & EUR 1,095.60 per ounce
30 Oct: USD 1,272.75, GBP 966.91 & EUR 1,093.80 per ounce
27 Oct: USD 1,267.80, GBP 968.35 & EUR 1,090.18 per ounce
26 Oct: USD 1,278.00, GBP 968.34 & EUR 1,082.34 per ounce
25 Oct: USD 1,273.00, GBP 964.81 & EUR 1,081.67 per ounce
24 Oct: USD 1,278.30, GBP 970.36 & EUR 1,087.32 per ounce
Silver Prices (LBMA)
31 Oct: USD 16.82, GBP 12.72 & EUR 14.45 per ounce
30 Oct: USD 16.74, GBP 12.69 & EUR 14.39 per ounce
27 Oct: USD 16.72, GBP 12.76 & EUR 14.38 per ounce
26 Oct: USD 16.97, GBP 12.84 & EUR 14.37 per ounce
25 Oct: USD 16.89, GBP 12.75 & EUR 14.34 per ounce
24 Oct: USD 17.04, GBP 12.92 & EUR 14.49 per ounce
Recent Market Updates
- Wozniak and Thiel Fuel Bitcoin-Gold Debate: Gold Comes Out On Top
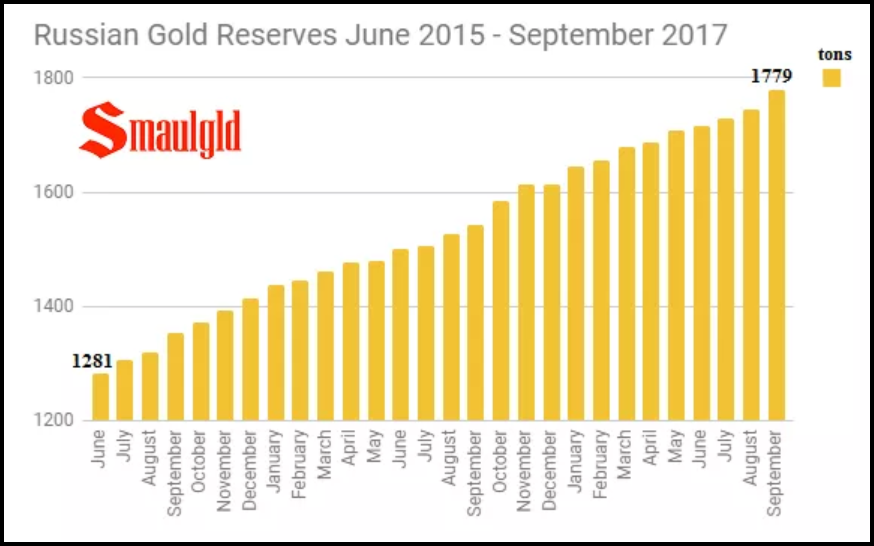
- Russia Buys 34 Tonnes Of Gold In September
- Gold Will Be Safe Haven Again In Looming EU Crisis
- Gold Is Valuable Due to “Extreme Rarity” – Must See CNN Video
- Gold Is Better Store of Value Than Bitcoin – Goldman Sachs
- Next Wall Street Crash Looms? Lessons On Anniversary Of 1987 Crash
- Key Charts: Gold is Cheap and US Recession May Be Closer Than Think
- Gold Up 74% Since Last Market Peak 10 Years Ago
- How Gold Bullion Protects From Conflict And War
- Silver Bullion Prices Set to Soar
- Brexit UK Vulnerable As Gold Bar Exports Distort UK Trade Figures
- Puerto Rico Without Electricity, Wifi, ATMs Shows Importance of Cash, Gold and Silver
- U.S. Mint Gold Coin Sales and VIX Point To Increased Market Volatility and Higher Gold
Important Guides
For your perusal, below are our most popular guides in 2017:
Essential Guide To Storing Gold In Switzerland
Essential Guide To Storing Gold In Singapore
Essential Guide to Tax Free Gold Sovereigns (UK)
Please share our research with family, friends and colleagues who you think would benefit from being informed by it.