Monday, May 30, 2016

David Morgan on the Dollar Demise: Silver Moves to China

Published here: http://redirect.viglink.com?u=http%3A%2F%2Fwww.zerohedge.com%2Fnews%2F2016-05-27%2Fdavid-morgan-dollar-demise-silver-moves-china&key=ddaed8f51db7bb1330a6f6de768a69b8


David Morgan on the Dollar Demise: Silver Moves to China

Posted with permission and written by SGT Report (CLICK FOR ORIGINAL)


David Morgan of The Morgan Report, an icon in the silver sector, returns to SGT Report to discuss the future of the US Dollar and the transfer of physical gold from West to East. More specifically, the transfer of gold and silver away from the Comex and the City of London's paper markets, to Chinese PHYSICAL precious metal markets like the Shanghai Gold Exchange, Shanghai Futures Exchange and the ABX.


It's becoming very clear that a sea change is underway as China hoards PHYSICAL silver at the Shanghai Gold Exchange, while openly encouraging Chinese citizens to acquire physical silver and gold as a way to protect wealth. It's a paradigm shift of epic proportion, away from paper promises and into PHYSICAL metal. David Morgan says,


Back roughly a decade or so ago, China was exporting roughly 100 million ounces of silver per year – exporting out of China. And then…it was roughly six years or so ago they started becoming a net importer of…a hundred million [ounces]. So that’s a 200-million ounce swing.


According to Steve St. Angelo from SRS Rocco Report, in just the past several weeks the Shanghai Futures Exchange's PHYSICAL silver stocks have increased from 54.7 million ounces to 60.6 million ounces, a figure that most certainly must leave officials at the Comex filled with envy, if not drowning in outright fear.


In this wide-ranging conversation, Sean from SGT Report and David also discuss Clif High's Web bot project. Originally developed in 1997 to predict stock market trends, the Web bots crawl the World Wide Web in search of speech markers, chatter and other specific data which can often predict future events. For some time now, the Web bot data has been predicting an explosion in the price of silver, with some of the precious metals language indicating that silver might one day achieve a 1 to 1 parity with gold as the USD finally meets its inevitable demise as the world's reserve currency.


Morgan says that silver is one precious metal that the Bankers fear. And though a silver to gold ratio of 1 to 1 is a very heady prediction, Morgan says it's actually possible given silver's extreme rarity, history and widespread use as an industrial metal.


"I think it's accurate… What people don’t seem to realize about silver in general, for my generation or perhaps people slightly older than me, was that…in 1965 we were issued slugs. But through 1968, you could actually take a silver certificate to the Treasury and get silver for it. So they were circulating 90% [silver] coins in the United States, until and through 1964. But it was illegal to own gold until 1973. So you had this gap between say, ’65 and ’73, where really all you could do if you understood monetary history at all, and Mr. Bunker Hunt certainly did, was to preserve your wealth in silver. …I’m just trying to give a little history here of why silver was probably thought of more as money back in that time-frame than it is now. I mean I read these articles every so often about silver not being money, which always makes me laugh, because the word “money” and the word “silver” are synonymous.…The gold standard is one step to fiat…If you could get the people to give up silver as money… [then] the bankers only had one metal to control, and they owned it. He who owns the gold makes the rules. So a gold-only standard is like the step required before you go to a full fiat system, whereas if you have a bi-metallic standard it’s more difficult for them [the bankers]. So believe me or not, the Establishment cares more about silver than they care about gold . Not from a monetary aspect, but probably from a control aspect."


As for the future of the US Dollar as the world's reserve currency, Morgan says:


"It appears strongly in all the evidence that I've studied that there is a faction or breakaway between the Anglo-American empire and let's call it the axis of the BRICS… I've always believed that it would unravel enough in my lifetime to be a substantial change, which means it's going to be probably a 20 year ordeal for my two daughters… I think it's continued longer than I first believed because to keep a Ponzi scheme going you need to have more people at the bottom."


So sit back, grab a cup of coffee and get ready for a far-reaching and dynamic discussion with Silver Guru David Morgan about the Dollar's demise and silver's very quantifiable move from west to the east.


Please email with any questions about this article or precious metals HERE


David Morgan on the Dollar Demise: Silver Moves to China

Posted with permission and written by SGT Report (CLICK FOR ORIGINAL)

Global Financial Crisis Coming – Japan Warns of “Lehman-Scale” Crisis At G7

Published here: http://redirect.viglink.com?u=http%3A%2F%2Fwww.zerohedge.com%2Fnews%2F2016-05-30%2Fglobal-financial-crisis-coming-%25E2%2580%2593-japan-warns-%25E2%2580%259Clehman-scale%25E2%2580%259D-crisis-g7&key=ddaed8f51db7bb1330a6f6de768a69b8

Global Financial Crisis Coming – Japan Warns of “Lehman-Scale” Crisis At G7

Japanese Prime Minister Shinzo Abe warned his Group of Seven counterparts on Friday that the world may on the brink of a global financial crisis on the scale of Lehman Brothers.

GoldCore: Total Global Debt since 2007
The Japanese Prime Minister presented data yesterday at the G7 summit he is hosting, showing that commodities prices have fallen 55 percent since 2014, the same margin they fell during the global financial crisis, interpreting this as “warning of the re-emergence of a Lehman-scale crisis”.

The Japanese Prime Minister Shinzo Abe failed in his attempt to have the G7 leaders warn of the risk of a global economic crisis in a communique issued as their summit wrapped up today in Japan.

The final statement failed to address the scale of the financial crisis facing the world today and instead gave the impression that the worst is over with somewhat Orwellian language which declared that G-7 countries “have strengthened the resilience of our economies in order to avoid falling into another crisis.”

The communique gives the impression that there is little risk due to strengthened, resilient economies when the truth is that there are significant risks facing the global financial system and the global economy. Some of which include:

• The global economy remains vulnerable to recessions and new debt crises. There are fragile recoveries in the Eurozone, UK and U.S. while Japan remains in a recession
• Financial and banking systems remains vulnerable as seen in the very sharp falls in bank shares in recent weeks. Spanish, Italian, Greek and German banks have seen sell offs
• Geopolitical risk in the Middle East (Syria, Saudi, Iran etc.), increasing tensions amongst Russia, China and western powers and the increasing spectre of terrorism and war
• The Eurozone crisis is far from resolved and there is the risk of debt crises in China, the U.S., the Eurozone and indeed the UK

• BREXIT causes a short term risk but the real risk is the poor financial fundamentals of the UK economy – total debt to GDP ratio (public and private) is over 450% and completely unsustainable.

Japan had pressed G-7 leaders to note “the risk of the global economy exceeding the normal economic cycle and falling into a crisis if we did not take appropriate policy responses in a timely manner.” However, leaders again failed to take leadership and opted for spin and again lulling their electorates into a false sense of security about the financial and economic outlook.

Rather than doing the responsible thing in this regard, there appears to have been an attempt to focus on BREXIT and to scare UK voters into not voting for a UK exit from the EU. German Chancellor Angela Merkel went as far as to say that BREXIT had not even been discussed but that there was a consensus that they wanted the UK to stay in the EU.

Yet, a 32-page declaration putatively from the G7 leaders declared that “A UK exit from the EU would reverse the trend towards greater global trade and investment, and the jobs they create, and is a further serious risk to growth.” Brexit was listed alongside geopolitical conflicts, terrorism and refugee flows as a potential shock of a “non-economic origin”.

Japan is right to be warning that there is a danger of the world economy careering into another financial crisis on the scale of the 2008 Lehman shock given the scale of the debt in the world today is much, much more than it was prior to the first financial crisis – see McKinsey Global Institute chart above.

Diversification remains the key to weathering the likely impact of the next financial crisis on financial markets and assets including deposits. Paper and digital assets, including digital gold, contain unappreciated risks such as bail-ins and inability to transact, be paid, liquidity etc.

Direct legal ownership of individually segregated and allocated gold coins and bars will again protect and grow wealth in the coming years.

Recent Market Updates
– Gold Should Rise Above $1,900/oz -“New Bull Market”
– World’s Largest Asset Manager Suggests “Perfect Time” For Gold
– Gold As “Extremely Low-Risk Asset” – Rogoff Advises Creditor Nations
– Silver – “Best Precious Metals Trade”
– Bank Bail-Ins Pose Risks To Depositors, Investors & Economies
– Take Delivery of Gold and Silver Coins, Store Gold Bars – Hobbs
– George Soros Buying Gold ETF And Gold Shares In Q1
– Hedge Funds Take Record Long Silver Position As Silver Bullion Deficit Surges


7 Key Storage Must Haves - Copy (1)
Learn the risks inherent in paper and digital gold

Gold and Silver Aren’t Getting Stronger, Report 29 May, 2016

Published here: http://redirect.viglink.com?u=http%3A%2F%2Fwww.zerohedge.com%2Fnews%2F2016-05-30%2Fgold-and-silver-aren%25E2%2580%2599t-getting-stronger-report-29-may-2016&key=ddaed8f51db7bb1330a6f6de768a69b8

The dollar moved up, though most people would say gold fell about $40, and silver 32 cents. In the mainstream view, the value of the dollar is 1/N (N is the quantity). So how could the dollar go up? Certainly, the quantity keeps on increasing.

Our view is different. If you borrow dollars to buy an asset, and the asset doesn’t produce generate enough yield to pay the interest, you have to sell or default. It should go without saying that it’s an unsustainable Ponzi scheme if everyone keeps borrowing more and more to simply bid up the price of any asset (including gold).

So here we are, and the dollar is getting more valuable again.

Let’s take a look at the supply and demand fundamentals. But first, here’s the graph of the metals’ prices.

       The Prices of Gold and Silver
prices

Next, this is a graph of the gold price measured in silver, otherwise known as the gold to silver ratio. The ratio was down a bit this week. 

The Ratio of the Gold Price to the Silver Price
ratio

For each metal, we will look at a graph of the basis and cobasis overlaid with the price of the dollar in terms of the respective metal. It will make it easier to provide brief commentary. The dollar will be represented in green, the basis in blue and cobasis in red.

Here is the gold graph.

       The Gold Basis and Cobasis and the Dollar Price
gold

The red line is back to a tight correlation with the green. That is, the price of the dollar is rising (i.e. the price of gold, measured in dollars is falling). Along with it, we finally see a noticeable rise in the scarcity of gold. Gold finally got a bit scarcer as its price fell another $40. Speculators finally flushed a bit, with stop orders getting hit in this brutal (to them) price action. Regular readers of Monetary Metals didn’t get caught, as we have been saying that the fundamental price of gold is below the market.

Our calculated fundamental price of gold is just under $1,170. Sure, gold got scarcer with the price drop. But only in proportion.

Now let’s turn to silver.

The Silver Basis and Cobasis and the Dollar Price
silver

The same pattern applies in silver.

As in gold, silver is scarcer at this lower price. Proportionally.

The fundamental is $13.90. This gives us a fundamental gold-silver ratio of about 84.


© 2016 Monetary Metals

Sunday, May 29, 2016

Is The Fed At Risk Of Choking The Market?

Published here: http://redirect.viglink.com?u=http%3A%2F%2Fwww.zerohedge.com%2Fnews%2F2016-05-29%2Ffed-risk-choking-market&key=ddaed8f51db7bb1330a6f6de768a69b8

Janet Yellen, vice Chair of the US Federal Reserve

Everybody was looking forward to hear what Janet Yellen had to say last week, as people were waiting for a cue about what the Federal Reserve might do next month and later this year. Will the Fed keep the interest rates stable? Or will we indeed see three additional rate hikes to push the benchmark interest rate towards 1.25%?

It’s not a secret the Federal Reserve has been slowly walking back on its previous promises as just five months ago, the institution said it would very likely implement no less than four rate hikes in 2016. We’re now nearing the end of May and not a single rate hike has occurred yet, and the chances of indeed seeing four, or even three rate hikes are now pretty much zero.

In fact, Yellen didn’t really bring any new data or details to light, although she now did go on record stating that a rate hike in June might be likely, but that the Fed would have to be very careful to make sure it’s not ‘choking’ the market. Yellen not hinted at the fact the interest rates would be gradually increased ‘at an appropriate time’, but warns for the impact of increasing the interest rates too fast and too high.

You might want to read between the lines here, and we are interpreting this as seeing a rate hike in June and perhaps one in September or October, but we are pretty certain there won’t be no third rate hike. And we’re not alone. If you’d have a look at the market data from the 30 Day Federal Funds futures, the market clearly doesn’t believe in aggressive rate hikes and still expects a very moderate increase in the interest rates. Just have a look at the futures for September and December:

Fed Interest Rate

Source: CME Group

Just to give you a better impression of what this means, the market is now expecting just a 28% chance to see a rate hike in June, but a 68% to see a rate hike by September. As you can see on the next image, the current price levels of the Fed Funds futures are indicating there’s a 32% chance nothing will happen, and a 46% chance the benchmark interest rate will be increased by one step.

Fed Futures

Source: CME Group FedWatch

More importantly this also indicated there’s just a 21% chance there will be a two-step rate hike and a very tiny 2.3% chance the Federal Reserve will boost the benchmark interest rate all the way up to 1.25%.

Sounds reasonable, no? But what we cared about the most were the longer-term expectations of the market. The expectations for February next year aren’t very different from September as the market is still just incorporating an 83% chance there will be a rate hike (which is just 15% more than in September), but what’s even more important is that the odds are in favor of just one rate hike, as there seems to be a 55% chance there will be no more than one hike.

Fed Probability 2

Source: ibidem

This means the market has indeed completely given up on expecting quite a few rate hikes this year and whereas the Fed was making bold statements about 3 or 4 rate hikes in 2016, the futures indicate there’s only an 11% chance there will be 3 rate hikes and a possibility of just 1.5% there will be at least four rate hikes. So that’s a non-existing possibility.

But the markets have also sent another signal. The gold price started to go down after Yellen said a rate hike is still on the table (well, more or less), but we would like to point out a very interesting phenomenon. As you can see on the next image which shows the closing prices of the gold futures on Friday, you can clearly see the June contract fell by $8/oz to $1212.4/oz, but the majority of yesterday’s volume was generated at the August-constracts which didn’t only show a slightly more moderate decline, but confirm the market is still expecting the gold price to increase

Fed Gold

Source: CME Group

Indeed, looking at the prices of the gold futures it’s pretty clear the market is expecting the yellow metal to perform pretty well. That really shouldn’t be a huge surprise as gold originally used to be a hedge against inflation, so an increased interest rate on the back of a higher inflation rate would actually be positive for the gold price!

Whether it’s a hedge against inflation or an insurance policy, gold should always have a place in your portfolio.

>>> Click here to read our Guide to Gold FOR FREE!

Secular Investor offers a fresh look at investing. We analyze long lasting cycles, coupled with a collection of strategic investments and concrete tips for different types of assets. The methods and strategies are transformed into the Gold & Silver Report and the Commodity Report.

Follow us on Facebook @SecularInvestor [NEW] and Twitter @SecularInvest

Saturday, May 28, 2016

The Next Big Crash Of The U.S. Economy Is Coming, Here's Why

Published here: http://redirect.viglink.com?u=http%3A%2F%2Fwww.zerohedge.com%2Fnews%2F2016-05-28%2Fnext-big-crash-us-economy-coming-heres-why&key=ddaed8f51db7bb1330a6f6de768a69b8

srsrocco

By the SRSrocco Report

Investors better be prepared as the next crash of the U.S. economy is coming.  This is not based on hype or speculation, rather due to the disintegration of the underlying fundamentals.  Matter-a-fact, the fundamentals are so completely AWFUL, that the next market crash will make 2008 look quite tame indeed.

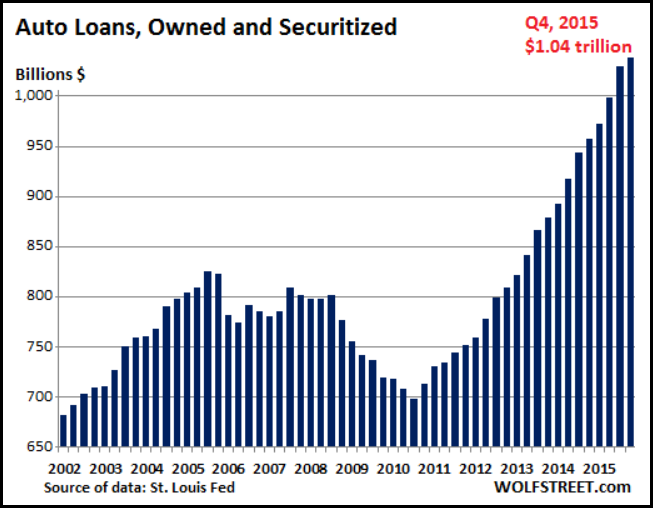
To get the skinny on the lousy fundamental data, let's first look at the Auto Industry.  The next series of charts come from the article, More Warnings--Unsustainable Auto Sales & Stock PE Ratios:

Auto Loans

Ever since the supposed economic turnaround, the amount of outstanding auto loans has increased dramatically from less that $700 billion in 2010 to over $1 trillion in the fourth quarter of 2015.  According to Wolf Richter, quoted in the article:

“Deep-subprime borrowers are high-risk. Typically they have credit scores below 550. To make it worth everyone’s while, they get stuffed into loans often with interest rates above 20%. To make payments even remotely possible at these rates, terms are often stretched to 84 months. Borrowers are typically upside down in their vehicle: the negative equity of their trade-in, along with title, taxes, and license fees, and a hefty dealer profit are rolled into the loan. When the lender repossesses the vehicle, losses add up in a hurry.

When I was younger, the longest automobile loan an individual could get was 48 months.  However, you were considered to be a REAL LOSER if you had to finance an automobile that long.  Now, 84 months is becoming the norm....LOL.

This is just one factor that shows just how weak the economy has become if Americans have to finance a car for seven years.

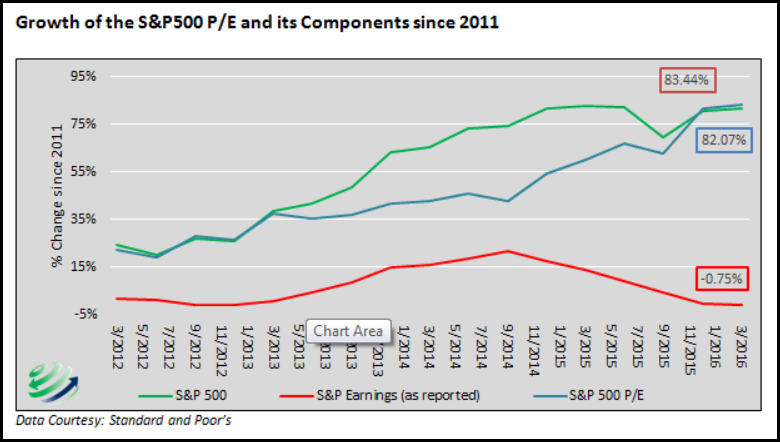
Here is another chart from the article linked above.  It shows just how inflated the S&P 500 index has become:

SP500

According to Michael Lebowitz of 720 Global Research (quoted in the article):

Since October 1, 2011, the S&P 500 has risen 82% on the heels of a 0.75% decline in earnings. The price to earnings ratio over that time period has risen 83%, with price gains contributing 99% to the increase. Prices have risen substantially, while earnings have actually fallen. The chart below highlights the growing gap between earnings and the S&P 500.”

As we can see from the chart, the S &P 500  and earnings have been surviving on HOT AIR, especially since the latter part of 2014.  When QE (money printing) and zero interest rates no longer provided enough bounce in the markets, the Fed, Central Banks and the Plunge Protection Team stepped in a BIG WAY to keep the markets from crashing.

So, not only do we have a highly over-leveraged automobile financed industry, the broader stock market valuations are in bubble territory.  Unfortunately, this is only part of the story.  If we look at the disintegrating U.S. Energy Industry, the situation is even more dire.

The Coming Collapse Of The U.S. Energy Industry

Today I did an interview with Money Metals Exchange.  I will be putting out the interview when it's published.  However, I discussed this energy subject matter during the interview.  When I first started the interview, I said the precious metals community was guilty of propagating hype and short-term surging price moves that never came true.  Thus, we have frustrated a lot of precious metals investors because the COLLAPSE of the Dollar, DEFAULT of the COMEX or much HIGHER gold and silver prices have not yet occurred.

So, am I guilty myself by putting out a new a headline that reads, "The Coming Collapse of the U.S. Energy Industry?"  No.... here's why.

The situation in the U.S. Energy Industry is so AWFUL, I wouldn't be surprised to see half of the industry go bankrupt over the next few years.  Of course, the U.S. Government could step in and either bail out or nationalize the energy industry, but this wouldn't stop the impending collapse.

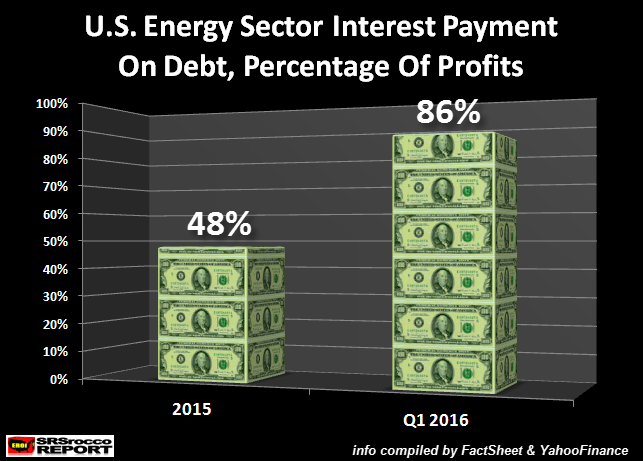
Let's take a look at this next chart.  The U.S. Energy Industry has added so much debt that it took nearly half of all its operating profits to just pay the interest on its debt in 2015:

Energy Sector Debt

While this was bad, it was even worse in the first quarter of 2016.  According to the article, Why Oil & Gas Companies Are Barely Scraping By, the U.S. Energy Sector paid 86% of its total profits just to service the interest on its debt.  Can you imagine that?

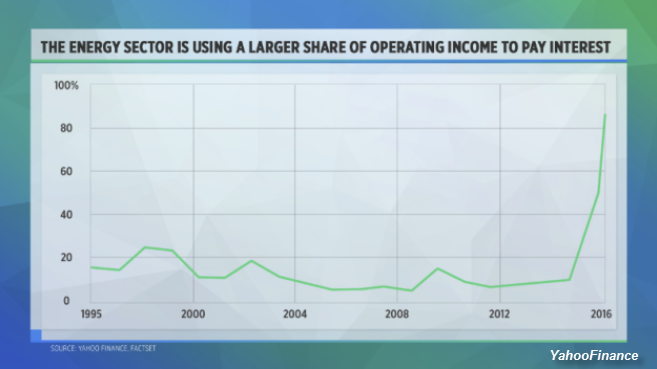
This chart from the article shows the huge change of interest payments on debt of the percentage of operating income in the U.S. Energy Sector:

Yahoo Finance Energy Debt

Since 2000, the U.S. Energy Sector was paying (on average) between 10-15% of its operating income to service its debt.  However, that changed significantly in 2014 as the price of oil plunged.  The reason this percentage jumped over 20% in 1998 was due to the price of oil falling below $15 compared to $22 in 1996.

So, why is the U.S. Energy Sector interest on the debt so much worse now with the price of oil more than double the 1998 price??  Again, the average annual price of oil in 1998 was $15 compared to $33 in Q1 2016.  Why did the U.S. Oil and Gas Industry have to pay 86% of its operating income to service its debt during the first quarter of 2016 on the back of a $33 oil compared to 25% on $15 oil in 1998?

BECAUSE.... The U.S. Oil & Gas Industry has gone into massive debt to bring on very expensive energy supplies.

Here is one more chart from the energy article linked above:

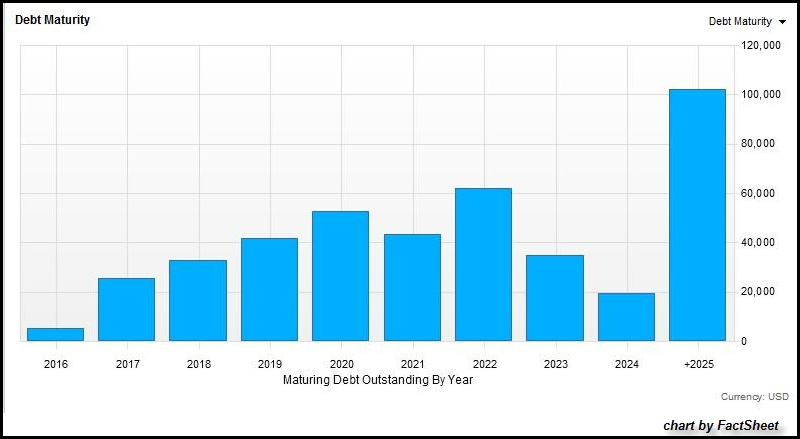
Energy Debt Maturity

This chart shows the U.S. Energy Sector maturing debt outstanding for each year.  According to the article:

While $5.1 billion of U.S. energy debt matures this year, $25.1 billion will mature in 2017. The number risies to $52.5 billion in 2020.

“There’s not a lot of this debt that comes due in 2016. But in 2017—that’s when the rubber will really hit the road. Now a lot of these companies are already looking to bankruptcy because people know that the bond position is untenable,” said Dicker.

As the article states, the outstanding U.S. energy debt that matures in 2017 ($25.1 billions) is five times what matures this year ($5.1 billion).  How can the U.S. Energy Industry pay back this debt when it can barely pay the interest on its debt currently?

And... to make matters even worse, U.S. oil production is falling rapidly:

US Oil Production

U.S. domestic oil production peaked at 9.6 million barrels per day (mbd) in June 2015 and is currently at 8.7 mbd.  This is nearly a 10% decline in U.S. oil production in less than a year.  Some may think this huge decline is due to lower oil prices.  That may be partly true, however U.S. oil production was going to decline even with higher oil prices.

Which means, the U.S. Energy Sector will be in even more trouble as oil production declines further as the amount of debt that matures continues to increase over the next several years.  This is extremely bad news for the U.S. economy as it will have to import more foreign oil to make up for declining domestic production.

Of course, this means the market will have to react by offering 96 and 108 month payment plans to keep the automobile financing bubble from popping.  Furthermore, I would imagine the Plunge Protection Team will work overtime just to keep the markets from imploding.

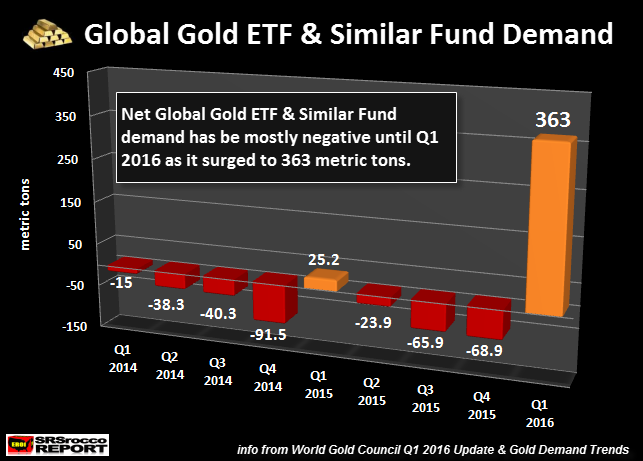
As the fundamentals of the market continue to deteriorate, the precious metals offer the only real safe haven.  As I mentioned in a previous article, Something Big Happened In The Gold Market, mainstream investors flocked into Gold ETF's in record numbers during Q1 2016:

Global Gold ETF demand

Investors moved into Gold ETF's in a big way during the first quarter of 2016 on a mere 2,000 point drop of the Dow Jones.  Why would investors move into Gold ETF in such a large degree as the market sustained a normal 15% correction??  Hell, in the first quarter of 2009, flows of gold into Gold ETF's surged to a record 465 metric tons, but this was when the Dow Jones was crashing to its lows of 6,700.

I talk to several people in the industry, and the word out there is that mainstream investors are worried as hell about the markets.  I believe when the broader markets really start their NEXT BIG CRASH, investors will flow into gold and silver in record volume.

This is not a matter of "IF", but "WHEN."  However, if we go by the disintegration market fundamentals, that day will likely be sooner, rather than much later.

Lastly, if you haven't checked out our new PRECIOUS METALS INVESTING page, I highly recommend you do.

Check back for new articles and updates at the SRSrocco Report.

Friday, May 27, 2016

Gold Prices Should Rise Above $1,900/oz -“Get In Now!”

Published here: http://redirect.viglink.com?u=http%3A%2F%2Fwww.zerohedge.com%2Fnews%2F2016-05-27%2Fgold-prices-should-rise-above-1900oz-%25E2%2580%259Cget-now%25E2%2580%259D&key=ddaed8f51db7bb1330a6f6de768a69b8

Gold prices are likely to rise above $1,900/oz in the next phase of the bull market and investors should “get in now,” Chief Market Analyst of the Lindsey Group, Peter Boockvar told CNBC’s “Futures Now” yesterday.

gold prices

“This is just the beginning of a new bull market in the metals,” Boockvar believes.

Ultimately, Boockvar believes that the 2011 highs of around $1,900 for gold are not only reachable, but surpassable, as he reasoned that bull markets historically exceed the previous bull market peak at some point.

As Boockvar sees it, it’s just a matter of when.

“In order to be bearish on gold, you have to believe that the Fed is going to embark on 100 to 200 basis points of hikes over the next couple of years, which I think is completely unrealistic,” added Boockvar. “This is an ideal opportunity for those who have not gotten in.”

Citing the relative strength index (RSI), Boockvar said that gold is the most oversold it has been since mid-December. He also added that global interest rates have given trillions of dollars’ worth of sovereign bonds a negative yield. Coupled with rising Fed rates, this development would theoretically provide gold investors with positive carry on gold. 

For additional context, Boockvar highlighted the mid-2000s, when the Fed raised the Federal funds rate from 1 percent to 5 percent. During that time, gold went from $400 to $700. The analyst also cited the start of 2016, when Bank of Japan Governor Haruhiko Kuroda adopted negative interest rates. However, the move failed to help the nation achieve stability in its currency.

Watch Boockvar’s interview on CNBC here

Recent Market Updates
– Gold and Silver “Bottom Is In” – David Morgan tells Max Keiser
– World’s Largest Asset Manager Suggests “Perfect Time” For Gold
– Gold As “Extremely Low-Risk Asset” – Rogoff Advises Creditor Nations
– Silver – “Best Precious Metals Trade”
– Bank Bail-Ins Pose Risks To Depositors, Investors & Economies
– Take Delivery of Gold and Silver Coins, Store Gold Bars – Hobbs

– George Soros Buying Gold ETF And Gold Shares In Q1

Gold and Silver News
Gold edges up, but stays near 7-wk low on Fed rate hike outlook – Reuters
Gold Snaps Six-Day Losing Streak as Rally in the Dollar Pauses – Bloomberg
Oil prices top $50, Asian shares struggle as China sags – Reuters
Pound Could Lose Its Reserve Currency Status on Brexit, S&P Warns – Bloomberg
Brexit Could Force UK to Extend Austerity by Two Years – Bloomberg

Greece’s “breakthrough” agreement is another “extend and pretend” – Telegraph
Why Strategas’ Chris Verrone Wants to Buy Gold (Video) – Bloomberg
Global Monetary System Has Devalued 47% Over The Last 10 Years – Zero Hedge
The Billionaires Are Wrong On Gold – Barisheff via Seeking Alpha
Dominick Frisby interviews James Rickards – Frisby’s Bulls & Bears
Read More Here


www.GoldCore.com

Silver Bullion: Industry Insider Sees Silver Prices Hitting $140

Published here: http://redirect.viglink.com?u=http%3A%2F%2Fwww.profitconfidential.com%2Fsilver%2Fsilver-bullion-industry-insider-sees-silver-prices-hitting-dollar-140%2F&key=ddaed8f51db7bb1330a6f6de768a69b8

This Could Send Silver Prices Soaring
When looking at silver bullion price forecasts, one prediction sticks out like a sore thumb. A Canadian miner called First Majestic Silver Corp (NYSE:AG) says the surge in smartphones and tablets is creating a shortage that could send silver prices up 775%.

Precious metals like silver are essential for electronics manufacturing. Demand for those metals has jumped in tandem with the spread of mobile devices, squeezing supply. Or at least that’s according to First Majestic CEO Keith Neumeyer.

Neumeyer says his firm was approached.

The post Silver Bullion: Industry Insider Sees Silver Prices Hitting $140 appeared first on Profit Confidential.

Thursday, May 26, 2016

A Crisis Unlike We Have Seen In Human History

Published here: http://redirect.viglink.com?u=http%3A%2F%2Fwww.zerohedge.com%2Fnews%2F2016-05-25%2Fcrisis-unlike-we-have-seen-human-history&key=ddaed8f51db7bb1330a6f6de768a69b8


A Crisis Unlike We Have Seen In Human History

Posted with permission and written by Rory Hall, The Daily Coin (CLICK FOR ORIGINAL)


I sat down with John Rubino of Dollar Collapse to discuss the current state of our economic world. In a very lively conversation, we hit some of the more pressing items of the day. John has done a fantastic job of documenting the demise of the dollar since he co-authored ”The Collapse of the Dollar” with James Turk back in 2004. John’s insights and analysis are top shelf and he should be on everyone’s list of people to follow.


How many “emergency” “secret” meetings do the central planners around the world need to have before the citizens of the respective countries begin to fully understand and take notice that something is very, very wrong? This year alone there have been several off-calendar meetings with, at least, one more now added to the docket.


The G-20 central planners have scheduled an “emergency” meeting for summer 2016. What will the topics be? Could it possibly be the fact the global economy is on the verge of total collapse? With the Baltic Dry Index, Shanghai Containerized Freight Index, not to mention commodities, all spiraling out of control to the downside, do you think there may be a reason for these people to be concerned? My guess is they could care less and are simply meeting in order to determine how the remaining wealth, in their respective countries, will be divided as the global economy continues grinding to a halt.


If one simply looks at the following line-items, it is clear for anyone to see something is about to hit the fan and it’s not anything anyone wants hitting the fan.


  •  45 million people in the U.S. on food stamps
  • some estimates as high as 10 million refugees flooding into the European Union
  •  non-stop wars of aggression involving NATO, Russia, Syria and several other countries
  • financial crisis that began in 2008 has not been addressed and the problems that started that year have grown larger and far deeper
  •  banking system in the European Union, especially Italy, is under enormous stress due to faulting/fraudulent accounting
  •  Federal Reserve balance sheet at $4 TRILLION – U.S. debt at $20 TRILLION and counting
  •  United Kingdom/Britain and the Brexit movement that is taking root
  •  U.S. Presidential candidates, Donald Trump and Bernie Sanders, garnering global attention as the citizens of the U.S. seek alternatives to the current embedded criminal politicians.
  • Japan instituting a Negative Interest Rate Policy (NIRP) for their sovereign bonds – Japan has basically been in a recession for over 20 years
  •  China is manufacturer to the world and with economies slowing down or shutting down, there is no reason to manufacture products


These are just a few of the items that are currently hampering growth for individual citizens and individual Western nations. Currently, there are just too many holes that need to be filled and the central bankers are losing control and the people are losing faith in the narratives they are being fed. Once faith is lost, en masse, the show will become a lot more interesting and a lot more dangerous.


In order for the show to remain at arm’s length, people need to understand their role in what is happening. We must have certain items in our possession at all times in order to avoid being swept away in the wave of economic collapse. Will this be a wave like you would see on TeeVee? Of course not. The “wave” was launched in 2008 and has been gathering momentum ever since. It will simply wash over your remaining wealth and leave you even more destitute than in your current situation.


Silver, gold and lead are must-haves for the rising tide of uncertainty. Long term food storage and the usual storable items that make your house a home need to be at the top of the list. There is plenty of information to help you get your house in order and there has never been a better time to keep the shelves stocked than right now.


Will this implode tomorrow or next week or next month? Who’s to say? What can be said is this: it is happening - your wealth is being drained at this moment. The central planners are absolutely terrified of something, otherwise, the continual “emergency” “secret” meetings would stop.


When an animal senses danger, they become irrational, their behavior becomes erratic and their actions unpredictable. This is exactly what we are witnessing with the central planners around the world. It is time to begin taking these signs seriously and putting into place personal protection, at all levels, in order to weather the storm and don’t forget the popcorn.


Please email with any questions about this article or precious metals HERE


A Crisis Unlike We Have Seen In Human History

Posted with permission and written by Rory Hall, The Daily Coin (CLICK FOR ORIGINAL)

Wednesday, May 25, 2016

“Only Money Outside Of the Matrix" Will Survive ...

Published here: http://redirect.viglink.com?u=http%3A%2F%2Fwww.zerohedge.com%2Fnews%2F2016-05-25%2F%25E2%2580%259Conly-money-outside-matrix-will-survive&key=ddaed8f51db7bb1330a6f6de768a69b8

Only Money Outside Of the Matrix" Will Survive ... 

“Gold and silver bottom is in”, renowned silver analyst David Morgan tells Max Keiser on the Keiser Report and warns about paper and digital proxies for money and gold. Morgan, also known as the ‘Silver Guru’ of the TheMorganReport.com, talks to Max about the gold, silver and global bond markets and the ponzi scheme that are these markets.

Also covered in the show are central banks creating a financial and economic system not free for its participants, the end of hegemony spotted in the price of Russian bonds and the Bank of Japan failing, yet again, to get any sign of life from the Japanese economy.

Morgan warns about the importance of owning physical gold coins and bars rather than paper or digital proxies for bullion and money. He points out how gold investors lost money in the MF Global fiasco and were exposed by the ABN AMRO unallocated gold account fiasco.

ABN AMRO, the largest Dutch bank and one of the largest banks in Europe announced in a letter to clients in April 2013 that that it would no longer allow clients to take delivery of their precious metals including gold, silver, platinum, and palladium bullion coins and bars. Instead, they paid account holders in a paper currency equivalent to the current spot value of the precious metal.

Thus, instead of legally owning a risk free, physical asset (a bullion bar or a bullion coin), the bank’s clients were unsecured creditors and were exposed to the bank and the financial system – somewhat defeating the purpose of owning precious metals.

The move highlighted once again the importance of owning physical bullion either in your possession (be that be in a safe or vault in a house, in the attic, under the floorboards or elsewhere in your possession) or in a secure vault in a country that is stable and respects property rights.

As Morgan concludes the interview, he points out that physically held and legally owned gold and silver bullion coins and bars is the

“Only money outside of the matrix, only money outside of the system and only money throughout 5,000 years of history that people trust … ”


Gold and Silver News
Gold hits 7-week low as Fed rate hike prospects boost dollar – Reuters
Venezuela’s Gold Holdings Contract 16% as Maduro Battles Crisis – Bloomberg
Gold Jewelry Sales in Hong Kong Face ‘Icy Winter’ on Tourist Downturn – Bloomberg
Gold Posts Longest Slump in Six Months on Fed Rate Signals – Bloomberg
Ancient ship found in desert — with gold aboard – WTSP

Global funds fear ‘summer of shocks’ despite boom in money growth – Telegraph
“The Endgame” For Druckenmiller – His Full ‘Apocalyptic’ Presentation – Zero Hedge
Delinquency Rates In U.S. Surge in 2016, Poised to Head Higher – Financial Sense
Forget a Dollar Collapse…Deflation Is a Much Bigger Threat to Your Wealth Right Now – Casey Research
Gold – Bullish Combination Could Prevail – Bullion Desk
Read More Here

Gold Prices (LBMA AM)
25 May: USD 1,220.75, EUR 1,094.77 and GBP 834.63 per ounce
24 May: USD 1,242.65, EUR 1,111.18 and GBP 852.71 per ounce
23 May: USD 1,250.40, EUR 1,115.84 and GBP 860.89 per ounce
20 May: USD 1,256.50, EUR 1,120.18 and GBP 862.75 per ounce
19 May: USD 1,253.75, EUR 1,117.74 and GBP 857.37 per ounce

Silver Prices (LBMA)
25 May: USD 16.27, EUR 14.55 and GBP 11.14 per ounce
24 May: USD 16.27, EUR 14.55 and GBP 11.14 per ounce
23 May: USD 16.31, EUR 14.55 and GBP 11.27 per ounce
20 May: USD 16.56, EUR 14.76 and GBP 11.35 per ounce
19 May: USD 16.60, EUR 14.81 and GBP 11.35 per ounce

    7_Key_Storage_Must_Haves.png

Learn the risks inherent in paper and digital gold

www.GoldCore.com

Precious Metals: Fake-Rally Ends, Hostage Markets Return

Published here: http://redirect.viglink.com?u=http%3A%2F%2Fwww.zerohedge.com%2Fnews%2F2016-05-24%2Fprecious-metals-fake-rally-ends-hostage-markets-return&key=ddaed8f51db7bb1330a6f6de768a69b8


Precious Metals: Fake-Rally Ends, Hostage Markets Return

Written by Jeff Nielson


Back at the beginning of 2009, we had a real rally in the precious metals sector. The price of gold increased by roughly 2 ½ times. Silver led the way, rising more than double that amount. And the precious metals miners soared much higher, leveraging the gains in metals prices – as they must do, in any legitimate rally.

The rally occurred immediately after the Crash of ’08, the manufactured crash at the end of the Big Banks’ previous bubble-and-crash cycle. It occurred after a sharp, ruthless take-down of precious metals prices had established a clear “bottom” in those markets. That rally was terminated in 2011, by the Big Banks, in one of the most-obvious price-capping operations in the history of markets.

What has followed is 5+ years of what has previously been referred to as “Hostage Markets”: markets which were kept in a permanent choke-hold since that date, with prices grinding steadily lower and lower. This brings us to the beginning of 2016.

At the beginning of this year; the price of gold did something which we had not seen for several years: it went up. At the beginning of this year; the mainstream media did something which we had not seen for several years: it began praising gold as an asset class – and announced that “a new rally” had begun. The talking heads proclaimed that the “fundamentals” for gold were now bullish, and thus the price should start to steadily rise.

There was never any reason to consider this to be a real, spontaneous rally, and several strong arguments to conclude that this was an upward price-fixing operation of precious metals prices, to set the stage for a larger, general crash, at the end of the current eight-year, bubble-and-crash cycle from the Big Bank crime syndicate.

1) Nothing at all has changed in precious metals markets (except the rhetoric of the mainstream media) versus the last 5+ years.

2) Silver has failed to “lead the way”, as it must in any/all legitimate rallies.

3) The Big Banks remain in complete control of all markets.

Taking these reasons in order, mainstream propagandists have proclaimed that precious metals markets are now supported by bullish fundamentals. However, the “fundamentals” for gold and silver have remained equally bullish throughout the 5+ years where we were forced to endure Hostage Markets. In other words, any “reason” that could be made for gold and silver prices to rise now was equally valid, at all times over the past 5+ years.

“Technical analysis” (a pseudo-science with little statistical validity) would argue that the reason we are supposedly seeing a rally in 2016 is because gold and silver have “built a base” over the past 5+ years, and thus are now “ready” for the next leg higher, in their long-term bull market. However, this argument only applies to asset classes which have already risen to fair-market value.

In 2011, even after the large 2+ year rally in these sectors, neither gold nor silver was even close to any fair-market price . As “monetary metals” the primary fundamental of gold and silver is that their prices mustreflect any/all increases in the supply of money (i.e. “inflation”).

When B.S. Bernanke perpetrated his infamous “helicopter drop”, printing U.S. funny-money at an astronomical rate, never before seen in any large economy in modern history, he ultimately quintupled the U.S. monetary base. The price of gold would have had to duplicate this quintupling, as a starting point, before one could even begin to consider this a fair-market price.

At the beginning of the Bernanke helicopter-drop, gold was priced at roughly $800/oz. This meant that the price of gold would have had to rise to at least $4,000/oz (at a minimum) before it would/could be necessary for the market to “build a base” (to support even higher prices).

While the price of silver did rise roughly proportionately in comparison to Federal Reserve funny-money creation, this was only because silver started the rally priced at roughly $8/oz – at a 100:1 price ratio versus gold. As educated readers are aware, the legitimate, long-term price ratio for gold and silver is 15:1, reflecting the natural occurrence of these metals in the Earth's crust. Thus the price of silver would have had to rise to over $50/oz (higher than its 2011 peak) just to be priced rationally versus gold at the start of 2009.

In other words, in order for silver to (rationally) reflect Federal Reserve money-printing and the long-term price ratio versus gold, first the price of silver would have had to rise by a factor of roughly seven (just to be rationally aligned versus the price of gold), and then it would have had to increase by an additional factor of five – to mirror the Federal Reserve's monetary insanity .

This means that the price of silver would have had to rise somewhere above $200/oz (in 2011), before there could be any rational argument that it was priced at fair-market value at that time. Thus, in 2011, when the prices of gold and silver were first capped, and then taken down, there was never any reason for that rally to have ended. The 5+ years of Hostage Markets which we saw with precious metals should have never occurred.

Similarly, at the start of this fake rally, the gold/silver price ratio was at an ultra-absurd level of roughly 80:1, with silver priced at roughly $13/oz (USD). Even if already priced at a correct price ratio, the price of silver would have to lead the price of gold in any legitimate rally because the silver market is much, much smaller. However, at the ultra-compressed price ratio which existed at the beginning of 2016, if a legitimate rally had begun in precious metals markets, the price of silver would have exploded out of the starting blocks – leaving gold well behind in its wake.

Instead, we saw the price of gold “rally” for the first two months of this year, while the price of silver lagged. Understand the arithmetic here. At an 80:1 price ratio, if only 1.5% of the money entering this sector went into silver, the price of silver would have had to rise at a faster rate than gold .

In the real world, the quantity of investment dollars going into silver is roughly parallel to the quantity of dollars going into gold. Had a similar ratio of investor dollars entered the bankers “paper bullion” markets the price of silver would have had to rise roughly 20 times faster/higher than the price of gold during this supposed rally.

The notion, in this “precious metals rally”, that no one was buying silver is patently absurd. The price of silver during most of this fake-rally wasn't merely improbable, it was impossible.

Lastly, the Big Bank crime syndicate remains totally in control of what we call our “markets” (for lack of a better word). Currency prices remain fixed (rigged). Equity market prices remain fixed (rigged). Bond market prices remain fixed (rigged). Are we to believe that the banksters simply 'forgot' to continue their precious metals price-fixing – even as the mainstream media was shouting the word “rally” at the top of its lungs?

Simply, the rise in the price of gold (and muted rise in silver) which has taken place this year could have only occurred with the tacit support – if not overt assistance – of the Big Bank crime syndicate. At the same time, it is common knowledge that the banksters are firmly committed to suppressing precious metals prices, at all times.

...central banks stand ready to lease gold in increasing quantities should the price rise. 

– Testimony of Federal Reserve Chairman Alan Greenspan, July 24th 1998

The bankers “stand ready” to suppress the price of gold. Always. Eternally. Thus when we saw precious metals prices start to rise steadily/modestly at the beginning of this year, while the bankers remain in complete control of our markets, it could only have been because they wanted prices to rise.

Why? This question has already been answered . The current eight-year, bubble-and-crash cycle manufactured by the Big Banks is nearing its end. When this Next Crash is detonated, this crime syndicate obviously doesn't want precious metals to stand out as “safe havens” -- as all of their corrupt, paper assets are plunging in value.

The problem: with gold and silver already at rock-bottom prices at the beginning of 2016, it would have been very difficult to crash those markets (along with everything else). Thus the banksters need to march gold and silver prices higher, to some modest level, before they were set up to be crashed along with all other asset classes.

Now, the fake-rally appears to be at its end. This headline has been repeated again and again and again and again in the mainstream media over the past several days.

Gold in Longest Slump since November as Fed Signals Higher Rates

 Translation: a Fed-head talked about raising interest rates, and the price of gold fell. It is a headline which could have been copied-and-pasted out of any mainstream publication, any week, during the 5+ years of Hostage Markets.

Now here is the important point. When precious metals began their real rally at the beginning of 2009, the Fed-heads were already promising to raise interest rates then, as well. In fact they were promising much more. The Federal Reserve solemnly promised to fully “normalize” interest rates – quickly and immediately – at the beginning of 2009. Not some token, 0.25% rate increase. Fully normalized interest rates: meaning a benchmark rate of at least 2 – 3%.

Precious metals markets ignored that talk. All through 2009; the Fed-heads “promised” to raise interest rates, and gold and silver prices rose. All through 2010; the Fed-heads “promised” to raise interest rates, and gold and silver prices rose. All through the first 4 months of 2011; the Fed-heads “promised” to raise interest rates, and gold and silver prices rose.

Then, suddenly, after 28 months of the Fed-heads “promising” to raise interest rates, never keeping their promises , and precious metals prices continuing to rise, we had this paradigm suddenly reverse, for no reason. After 28 months of consecutively telling the same lie; suddenly precious metals prices began falling steadily, via nothing more than the same Compulsive Liars telling the same lie – which had previously been completely ignored.

The precedent, over the past eight years, is unequivocal. In a real rally, precious metals prices are not deterred from rising via Compulsive Liars simply repeating the same lie, over and over and over. It is only in the realm of Hostage Markets where (supposedly) these markets “react” to the same lie (and same Liars) which they had previously ignored, for several years.

A Fed-head talks, and precious metals markets fall. Readers are invited to call this paradigm of fraud anything that they want. But the one thing they can't call this is “a rally”.


Please email with any questions about this article or precious metals HERE


Precious Metals: Fake-Rally Ends, Hostage Markets Return

Written by Jeff Nielson


Tuesday, May 24, 2016

Q1 2016 Canadian Silver Maple Sales Surge To Highest Record Ever

Published here: http://redirect.viglink.com?u=http%3A%2F%2Fwww.zerohedge.com%2Fnews%2F2016-05-24%2Fq1-2016-canadian-silver-maple-sales-surge-highest-record-ever&key=ddaed8f51db7bb1330a6f6de768a69b8

srsroco

By the SRSrocco Report

The Royal Canadian Mint just published its Q1 2016 Report, and the silver bullion coin sales figures were stunning to say the least.  Not only did sales of Canadian Silver Maple Leafs surpass its previous record during the third quarter last year, it did so by a wide margin.

Why is this such a big deal?  Because Q1 2016 sales of Silver Maples topped the Q3 2015 record, without surging demand and product shortages.  Last year, there was a huge spike in silver retail investment demand due to the supposed "Shemitah" or the collapse of the broader stock markets.  Investors piled into silver in a big way as they perceived a year-end market crash was inevitable.

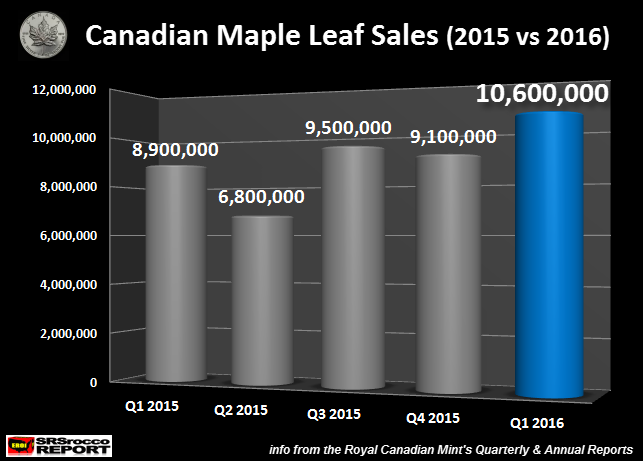
During last August and September, some websites stated 2 month delivery wait times for certain products such as Silver Eagles and Silver Maples.  With the huge spike in demand, sales of Canadian Silver Maples reached 9.5 million oz (Moz) in Q3 2015.  Although, once investors became more relaxed as the broader markets turned around, demand for physical silver investment cooled down.  Thus, Silver Maple sales declined to 9.1 Moz in the last quarter of 2015.

However, something very interesting took place during the first quarter this year.  Sales of Silver Maples jumped to an all-time record high of 10.6 Moz:

Q1 2016 Silver Maple Sales

Actually, I was quite stunned by the figures published in the recent Royal Canadian Mint Report.  Sales of Silver Maples jumped 1.1 Moz in Q1 2016 vs Q3 2015, with no real spike in overall retail investment demand.  Which means, investors bought more Silver Maples in Q1 2016 than any other quarter in history.

Furthermore, if Silver Maple sales continue to be this strong, the Royal Canadian Mint is on track to sell over 40 Moz compared to the 34.3 Moz in 2015.  If Silver Eagle sales also continue on their strong trend of 1 Moz per week, the U.S. Mint could sell over 50 Moz of these coins.  Together, these two official mints could sell over 90 Moz of Silver Eagles and Maples in just one year.

This goes to show investors who are frustrated by the short-term price moves of gold and silver, that the market continues to purchase record volumes of these official coins... regardless.

I do believe the value of the precious metals will rise to levels much higher than we can imagine, but it will come when the Greatest Financial Paper Ponzi Scheme finally collapses.  So, it's best to continue focusing on the fundamentals, rather than short-term price predictions.

Check back for new articles and updates at the SRSrocco Report.

World’s Largest Asset Manager Blackrock: “Perfect Time” For Gold

Published here: http://redirect.viglink.com?u=http%3A%2F%2Fwww.zerohedge.com%2Fnews%2F2016-05-24%2Fworld%25E2%2580%2599s-largest-asset-manager-blackrock-%25E2%2580%259Cperfect-time%25E2%2580%259D-gold&key=ddaed8f51db7bb1330a6f6de768a69b8

World’s Largest Asset Manager Blackrock: “Perfect Time” For Gold

The world’s largest asset manager, Blackrock Inc., has written a note about gold in which it suggests that this is the “perfect time and place” for gold due to “low and even negative yields, slow growth and potential signs of rising inflation.”

blackrock_blog_gold

BlackRock has over $4.6 trillion in assets under management and provides guidance to individuals, financial professionals and institutions and the note was written by Russ Koesterich, the Head of Asset Allocation for a leading Blackrock fund.

The blog, ‘Are these the golden days for gold?’ published by Blackrock last week, points out that “gold may continue to shine”:

“Given slow growth, a cautious Federal Reserve and the proliferation of negative sovereign yields in Japan and Europe, U.S. real rates are likely to remain low for the foreseeable future. At the same time, both core inflation and wages have been firming while the inflation drag from last year’s strong dollar and collapse in oil is beginning to fade. This is exactly the type of environment that has historically been most favorable to gold.”

Blackrock believe that the “unusually low level of  real interest rates (i.e. after inflation)” now make the asset class of gold a potential remedy:

“All told, this is a serious problem for yield starved investors. Ironically, one potential remedy is to take a second look at an asset class that provides no income: gold.”

In March, BlackRock joined Pacific Investment Management Co. (PIMCO) in recommending inflation linked bonds and gold, warning costs are poised to pick up and there is a growing risk of inflation. “We like inflation-linked bonds and gold as diversifiers” said New York-based BlackRock.

“The strategy tactically invests in multiple inflation-sensitive asset classes, allocating across a broad opportunity set of real assets, including global inflation-linked bonds, commodities, real estate, currencies and gold …

Gold has characteristics of both a commodity that is easily stored for a long period of time and a currency whose supply is limited.”

Amen to that. Hopefully Blackrock will advise investors and institutions internationally about the changed dynamics in the gold market due to low and negative interest rates.


Recent Market Updates
Buy Gold As “Extremely Low-Risk Asset” – Rogoff Advises Creditor Nations
Silver – “Best Precious Metals Trade”
Bank Bail-Ins Pose Risks To Depositors, Investors & Economies
Take Delivery of Gold and Silver Coins, Store Gold Bars – Hobbs

George Soros Buying Gold ETF And Gold Shares In Q1
Hedge Funds Take Record Long Silver Position As Silver Bullion Deficit Surges

Gold and Silver News
Gold holds near 3-1/2 week low on Fed rate hike prospects – Reuters
Gold Holds Four-Day Drop as Fed ‘Procession’ Signals Rate Rise – Bloomberg
European Shares Rise as Investors Weigh Implications of Fed Talk – Bloomberg
Lacking new ideas, G7 to agree on ‘go-your-own-way’ approach – Reuters
Banks Must Defend Libor Lawsuits After Judges Warn of Impact – Bloomberg

Gold Rally is Here to Stay says Lombard Odier (Video) – Morning Star
Silver Shortage Or No Shortage? Renowned Silver Expert David Morgan – Youtube
First Soros… Now Jim Rogers Predicts Trillion-Dollar ‘Biblical’ Crash – Dollar Vigilante
High priest of helicopter money speaks (Daily Reckoning)
A Debt Agenda for the G7 (Project Syndicate)
Read More Here

Gold Prices (LBMA AM)
24 May: USD 1,242.65, EUR 1,111.18 and GBP 852.71 per ounce
23 May: USD 1,250.40, EUR 1,115.84 and GBP 860.89 per ounce
20 May: USD 1,256.50, EUR 1,120.18 and GBP 862.75 per ounce
19 May: USD 1,253.75, EUR 1,117.74 and GBP 857.37 per ounce
18 May: USD 1,270.90, EUR 1,127.21 and GBP 882.05 per ounce

Silver Prices (LBMA)
24 May: USD 16.27, EUR 14.55 and GBP 11.14 per ounce
23 May: USD 16.31, EUR 14.55 and GBP 11.27 per ounce
20 May: USD 16.56, EUR 14.76 and GBP 11.35 per ounce
19 May: USD 16.60, EUR 14.81 and GBP 11.35 per ounce
18 May: USD 17.05, EUR 15.13 and GBP 11.77 per ounce


Buy gold and silver coins and bars with GoldCore today 

Monday, May 23, 2016

Buy Gold As “Extremely Low-Risk Asset” – Rogoff Advice To Creditor Nations

Published here: http://redirect.viglink.com?u=http%3A%2F%2Fwww.zerohedge.com%2Fnews%2F2016-05-23%2Fbuy-gold-%25E2%2580%259Cextremely-low-risk-asset%25E2%2580%259D-%25E2%2580%2593-rogoff-advice-creditor-nations&key=ddaed8f51db7bb1330a6f6de768a69b8

Buy Gold As “Extremely Low-Risk Asset” – Rogoff Advice To Creditor Nations

Buy gold as it is an “extremely low-risk asset” is the advice of Professor Kenneth Rogoff to emerging market, creditor nation central banks including the People’s Bank of China (PBOC).

Rogoff believes that there is a good case to be made that emerging market central banks, such as the People’s Bank of China who have over $3.3 trillion in foreign exchange reserves, accumulate gold as this would “help the international financial system function more smoothly and benefit everyone”.

gold_Russia_April
Russian central bank bought another  500,000 troy ounces of gold in April (ShareLynx)


Rogoff is a thought leader and a leading voice of western central banks. He was the chief economist of the International Monetary Fund from 2001 to 2003 and is the Professor of Economics and Public Policy at Harvard University.

Writing in Project Syndicate Rogoff notes that:

“Moreover, there is a case to be made that gold is an extremely low-risk asset with average real returns comparable to very short-term debt. And, because gold is a highly liquid asset – a key criterion for a reserve asset – central banks can afford to look past its short-term volatility to longer-run average returns.”

Rogoff notes that creditor nation central banks have been accumulating gold already but at a snail’s pace:

“Emerging markets have remained buyers of gold, but at a snail’s pace compared to their voracious appetite for US Treasury bonds and other rich-country debt. As of March 2016, China held just over 2% of its reserves in gold, and the share for India was 5%. Russia is really the only major emerging market to increase its gold purchases significantly, in no small part due to Western sanctions, with holdings now amounting to almost 15% of reserves.”

The latest data from Russia shows that the Russian central bank bought another  500,000 troy ounces of gold in April (see chart above).

Russia and China continue to be the largest sovereign buyers of gold today and central bank demand remained robust in the first quarter of the year – central banks purchased 109 metric tonnes. This represents the 21st consecutive quarter that central banks have been net purchasers of gold as they continue to diversify their huge exchange reserves and significant US dollar exposures.

Despite the steady buying, most creditor nations still hold less than 10% of their reserves in gold compared to 60% to 100% in large debtor nations such as the US, Greece, Italy, France and others.

foreign exchange reserves
Source Wikipedia 

Other emerging market creditor nation central banks with large foreign exchange reserves include Saudi Arabia, India, Brazil, Mexico, Thailand, Algeria, Iran, Turkey, Indonesia, Malaysia and United Arab Emirates (UAE).

The article by Rogoff is an important one and yet, like many recent significant developments in the gold market, it got surprisingly little mainstream media coverage.

It is another sign that gold is being re-monetised in the global financial and monetary system.

It also bodes well for gold’s outlook as the massive scale of international foreign exchange reserves means that even a small allocation into the small physical gold market by creditor nation central banks should see gold reset to much higher levels in all currencies. This may be why Professor Rogoff says  regarding gold that “there is no limit to its price.”

See full article on Project Syndicate here


Recent Market Updates
Buy Silver – “Best Precious Metals Trade”
Bank Bail-Ins Pose Risks To Depositors, Investors & Economies
Take Delivery of Gold and Silver Coins, Store Gold Bars – Hobbs

George Soros Buying Gold ETF And Gold Shares In Q1
Hedge Funds Take Record Long Silver Position As Silver Bullion Deficit Surges


Gold and Silver Prices and News
Gold holds earlier losses on firmer Asian shares – Reuters
Gold Options Traders Remain Bullish Even After Price Dip – Bloomberg
Dubai Investor Set to Open Monaco’s First Gold Refinery in 2017 – Bloomberg
Buy Gold on Dips as Fed May Have to Backtrack, Mideast Bank Says – Bloomberg

One of the World’s Most Expensive Countries Is Debating Giving Away Money – Bloomberg
Silver Lower Today Than Was In December 1979 – Smaul Gold
Counterfeit gold and silver coins burning buyers – WCPO
Middle East, OPEC nations may be first to return to gold standard – Examiner
Doug Casey’s Four-Part Plan to Fix a Broken Economy – Casey Research


Gold Prices (LBMA AM)

23 May: USD 1,250.40, EUR 1,115.84 and GBP 860.89 per ounce
20 May: USD 1,256.50, EUR 1,120.18 and GBP 862.75 per ounce
19 May: USD 1,253.75, EUR 1,117.74 and GBP 857.37 per ounce
18 May: USD 1,270.90, EUR 1,127.21 and GBP 882.05 per ounce
17 May: USD 1,270.10, EUR 1,121.43 and GBP 877.50 per ounce

Silver Prices (LBMA)
23 May: USD 16.31, EUR 14.55 and GBP 11.27 per ounce
20 May: USD 16.56, EUR 14.76 and GBP 11.35 per ounce
19 May: USD 16.60, EUR 14.81 and GBP 11.35 per ounce
18 May: USD 17.05, EUR 15.13 and GBP 11.77 per ounce
17 May: USD 17.08, EUR 15.09 and GBP 11.80 per ounce

Protecting_Your_Savings_in_the_Coming_Bail_In_Era_-_Copy-3.jpg   Storing_Gold_in_Switzerland   7_Key_Storage_Must_Haves.png

Read Our Most Popular Guides in Recent Months


www.GoldCore.com 

Sunday, May 22, 2016

Do These Charts Reveal That The Next Chinese Yuan Devaluation Is Right Around The Corner?

Published here: http://redirect.viglink.com?u=http%3A%2F%2Fwww.zerohedge.com%2Fnews%2F2016-05-22%2Fdo-these-charts-reveal-next-chinese-yuan-devaluation-right-around-corner&key=ddaed8f51db7bb1330a6f6de768a69b8

China economic growth

After the Fed tried to cause some more confusion with its decision to hike the interest rates by saying that a rate hike in June still is a possibility, we wanted to have a closer look at China which once again posted weaker than expected numbers.

We are very interested in all developments in China, as the country remains one of the largest net buyers of our favorite metal gold. Even though its economy is definitely growing at a (much) slower rate, the gold purchases haven’t been impacted, but the main question is whether these purchases are indeed to prepare the country for a total collapse of the financial system, or just to show the outside world the balance sheet of the central bank has some robust back-up assets that would allow it to print more money to try to support the economy.

US Dollar Chinese Yuan

Indeed, the Chinese export growth fell in April to a -1.8% YoY basis after seeing a sharp increase of in excess of 11% in March. Granted, the March-boost was very likely caused by the Chinese new year which resulted in a temporary export ‘stop’ during the new year, where after inventories were cleared out. So, okay, the lower export number didn’t really bother us that much, but what caught our attention was the fact the imports into China have been falling for 18 (!) consecutive months now which definitely is an indication of a crumbling domestic market.

That’s an important conclusion, and a first step in our central thesis in this article. Despite a declining export rate and a continuous freefall in the total amount of goods imported into China, the central government is sticking with its growth plan and wants to see the economy grow by 6.5-7% this year.

And that’s where everything is about to go completely wrong. There clearly isn’t a high demand for foreign products in China, nor is there a huge demand for Chinese products abroad, so the only way the growth numbers in the economy could be propped up is by making another giant flood of credit available. And now, several months (and even more than a year) since we started to warn about the Chinese problem, the data are finally confirming our suspicions.

Let’s have a look at the total debt in the Chinese economy (household debt + corporate debt + government debt).

China Total Debt

Source: ABN AMRO

Yes, your first conclusion might indeed be there’s nothing wrong here as the majority of the debt increase has been the result of non-government credit expansion. But that’s another reason why you should never take any information or charts for granted, as China has quite a few government-owned companies, and the debt of those companies most definitely isn’t counted as government debt. Throw in the fact the Chinese household debt vs the GDP has more than tripled in the past 10 years, and you realize there’s a widespread bubble in all of the society’s layers.

China Household Debt

Source: tradingeconomics.com

Of course, a 200% increase in the household debt to GDP ratio doesn’t sound too bad for a developing country, but keep in mind the GDP has also increased substantially. So whereas the net household debt was just $300B in 2006, this has increased to a stunning $4T as of at the end of 2015. That’s right, the amount of household debt in China has increased by 1233% in just 9 years. That’s an CAGR of 33.4% PER YEAR.

And then there’s one final chart we’d like to show, and that’s the investment growth in the country’s real estate sector. We have seen numerous reports about ‘ghost cities’, and it doesn’t look like the Chinese government is reducing the total investment in real estate and construction.

China 2

Source: ABN Amro

Indeed, whilst the private sector continues to slow down its investment in new real estate related projects, the government is stepping up the plate and has been increasing its investment sharply. Yep, we will see more and more ghost cities in China!

All in all, these charts explain why China has a serious problem at hand, and isn't capable to render enough autonomous growth to offset these issues. Throw on top of that the renewed strength of the US Dollar, and one can easily see that a new storm is brewing, with another (possible violent) Yuan devaluation looming on the horizon.

And perhaps that’s the reason why China continues to buy more gold, to make sure it has gold as a back-up plan to keep at least some of its credibility and creditworthiness. China added in excess of a million ounces of gold in the first quarter of this year, and continues to purchase gold month after month. 

>>> Start to protect yourself: read our 'Guide to Gold' right now!

Secular Investor offers a fresh look at investing. We analyze long lasting cycles, coupled with a collection of strategic investments and concrete tips for different types of assets. The methods and strategies are transformed into the Gold & Silver Report and the Commodity Report.

Follow us on Facebook @SecularInvestor [NEW] and Twitter @SecularInvest

Buy Silver – “Best Precious Metals Trade”

Published here: http://redirect.viglink.com?u=http%3A%2F%2Fwww.zerohedge.com%2Fnews%2F2016-05-22%2Fbuy-silver-%25E2%2580%2593-%25E2%2580%259Cbest-precious-metals-trade%25E2%2580%259D&key=ddaed8f51db7bb1330a6f6de768a69b8

Buy Silver – “Best Precious Metals Trade”

“Buy silver, sell gold” is the bold call of currency, bullion and money analyst Dominic Frisby in the latest edition of best selling Money Week.

Gold/silver ratio chart

Frisby looks at the relative value of silver to gold and comes to the conclusion that silver is a better buy right now. We share his bullish view on silver and hence our current campaign regarding VAT free silver coins.

From the article:

“Today we consider gold and silver.

We suggest that you should buy one and sell the other.

We then advise walking away for a couple of years…

Silver and Mother Nature’s ratio

There is, say the wise old men of geological lore, something like 15 times as much silver in the Earth’s crust as there is gold. Received wisdom is that in days gone by, the value of silver relative to gold reflected the amount of metal Mother Nature has given us: gold was, for hundreds of years, about 15 times the price of silver.

Last year 27,579 tonnes of silver were produced (according to my most reliable of precious metal data sources, Nick Laird of Sharelynx) and about 3,000 tonnes of gold. In other words, just over nine times as much as silver as gold was produced.

However, the gold price – about $1,270 an ounce – is about 75 times silver’s price of $17 an ounce. What gives?”

Dominic kindly mentions us as a bullion dealer who will buy gold bullion from you and sell silver coins and bars to you:

“If you want to buy physical silver, our friends in Dublin, the precious metals dealers GoldCore, have a new scheme whereby you can buy silver coins VAT-free. They’ll also, as most dealers will, buy your gold”.

We make a market in all popular bullion formats from small gold sovereigns to large 400 ounce gold bars and at the risk of doing ourselves out of business, we would caution against selling gold bullion right now.

Sell paper and digital gold, like Bullion Vault, maybe but not physical gold coins and bars. Rather both physical gold and silver bullion should be owned as financial insurance and hedges against currency debasement, bail ins, systemic and counter party risks and the myriad other risks today.

There is the possibility that gold continues to outperform silver in the short term. This is quite likely if we get another bout of severe deflation and the next stage of the global financial crisis. There is also the real chance of the currency reset where gold prices are revalued by the global monetary authorities to $5,000 to $10,000 per ounce. This could see silver underperform in the short term.

Silver remains severely undervalued versus gold but more particularly versus stocks, bonds and other financial – digital and paper – assets and we believe will outperform most assets in the coming years. Allocations to both depend on risk appetite and motivations for buying.

Read the full article by Dominic Frisby on MoneyWeek here.


Market Updates This Week

Bank Bail-Ins Pose Risks To Depositors, Investors & Economies
Take Delivery of Gold and Silver Coins, Store Gold Bars – Hobbs
George Soros Buying Gold ETF And Gold Shares In Q1
Hedge Funds Take Record Long Silver Position As Silver Bullion Deficit Surges


Gold and Silver Prices and News
Gold down 1.4% for week on Fed rate views – Reuters
Asian shares set for weekly loss, Fed talk lifts dollar – Reuters
Gold Takes ‘Brunt of the Selling’ as Fed Primes Markets for Hike – Bloomberg
Philly Fed index dips to negative 1.8 in May – Morning Star
Gold jewelry is getting pricier – CNN Money

Warning signs everywhere that the British housing bubble is about to go POP! – This Is Money
English Farm Prices Fall Most Since 2008 on Brexit Fears – Bloomberg
Rating agencies highlight the gloomy Brexit scenarios – Irish Times
Market Impact of Brexit Is Key Concern for G-7 Finance Chiefs – Bloomberg
George Soros Takes Massive Gold Position, Fears of a Crisis Grow – Value Walk

Gold Prices (LBMA AM)
20 May: USD 1,256.50, EUR 1,120.18 and GBP 862.75 per ounce
19 May: USD 1,253.75, EUR 1,117.74 and GBP 857.37 per ounce
18 May: USD 1,270.90, EUR 1,127.21 and GBP 882.05 per ounce
17 May: USD 1,270.10, EUR 1,121.43 and GBP 877.50 per ounce
16 May: USD 1,281.00, EUR 1,132.04 and GBP 892.87 per ounce

Silver Prices (LBMA)
20 May: USD 16.60, EUR 14.81 and GBP 11.35 per ounce
19 May: USD 16.60, EUR 14.81 and GBP 11.35 per ounce
18 May: USD 17.05, EUR 15.13 and GBP 11.77 per ounce
17 May: USD 17.08, EUR 15.09 and GBP 11.80 per ounce
16 May: USD 17.32, EUR 15.30 and GBP 12.07 per ounce


Protecting_Your_Savings_in_the_Coming_Bail_In_Era_-_Copy-3.jpg   Storing_Gold_in_Switzerland   7_Key_Storage_Must_Haves.png

Read Our Most Popular Guides in Recent Months