Saturday, April 30, 2016

PRECIOUS METALS INVESTOR: Must See Important Charts & Data

Published here: http://redirect.viglink.com?u=http%3A%2F%2Fwww.zerohedge.com%2Fnews%2F2016-04-30%2Fprecious-metals-investor-must-see-important-charts-data&key=ddaed8f51db7bb1330a6f6de768a69b8

SRSrocco Report Ico

By the SRSrocco Report

The U.S. and world economies are in serious trouble.  Unfortunately, the majority of analysts continue to put out increasingly worthless forecasts as they fail to understand the true nature of the problem... or rather, the predicament we are facing.

We must remember, problems have solutions while a predicament may be too difficult to solve.  According to the Cambridge definition of Predicament:

Predicament: noun[c]: an unpleasant or confusing situation that is difficult to get out of or solve.

With no money and no job, he found himself in a real predicament.

Mankind enjoys slapping itself on the back when it comes up with new technologies to solve problems.  However, solving problems with technology in the short run creates even larger problems in the longer run.  For example, how does the U.S. Federal Government maintain the massive infrastructure that technology help to create if there aren't available funds to do so???

You see this is very similar to the example given above in the predicament definition.  With no money and no job, he found himself in a real predicament.  Some individuals would just scoff at the unemployed person and tell him to get a job at McDonalds or some other high-class establishment.  But, what if there were no jobs to be found as was true during the Great Depression?

Furthermore, the employment situation in the United States is much worse than the official estimates put out by the Bureau Of Labor Statistics.  If we go by the unemployment measures we used a few decades ago, true U.S. unemployment is closer to 25%.  It is just impossible to get all of the 25% of unemployed Americans a job today.  So, this is a serious chronic unemployment predicament with no real solution.

Why?  Because it all has to do with ENERGY.  The following charts and data will provide the precious metals investor the critical reason to own gold and silver.

NOTE:  If you haven't checked out our new PRECIOUS METALS INVESTING PAGE, please do.

The United States Is In Serious Trouble... And Most Americans Don't Realize It

EROI iconIf you look at the SRSrocco Report Icon on the top left corner of the site, you will see this EROI Red Square with a silhouette of the United States in it.  There is a very good reason I designed that graphic to be included in my icon.  According to my analysis of the top minds who study the EROI - Energy Returned On Invested, this is the most important factor that controls life as we know it.

The collapse of the Ancient Roman Empire was attributed to many factors, but the overriding reason was due to the Falling EROI.  The Roman Empire grew by acquiring lands and their resources.  Some of these resources were stolen wealth from the rich families in the lands the Romans had conquered.  However, as the years went by, the Romans conquered less lands, but spent an increasing amount of wealth (energy) to defend what they had.

The collapse of the Roman Empire came as the wealth (energy) needed to keep foreign invaders out as well as the masses happy, exceeded the wealth (energy) the empire could acquire.  Thus, the Falling EROI of the Roman Empire (as well as most empires in the past) was the number one cause of its demise.

This will also be true for the U.S. Empire.  I am not proud to say that, but this is no secret if you read those who research and study the EROI.   The following chart was taken from the 8020vision.com website based on a white paper, A New Long Term Assessment of Energy Return on Investment (EROI) for U.S. Oil and Gas Discovery and Production, from scientists Megan Guilford, Charles Hall, Pete O' Conner, and Cutler Cleveland:
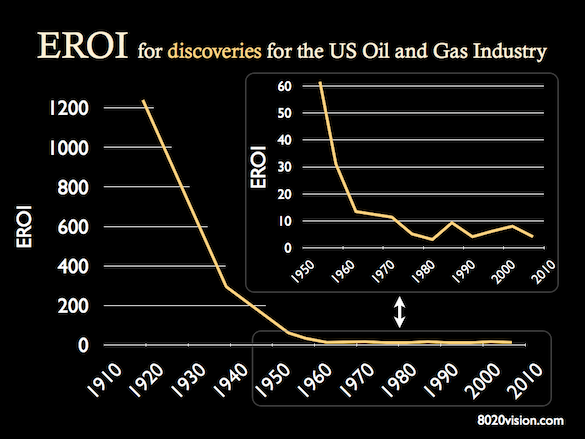
EROI Oil Discoveries

This chart shows the falling EROI - Energy Returned On Invested of U.S. oil and gas discoveries.  In 1910, the U.S oil industry was finding more than 1,200 barrels of oil for each barrel of oil (energy equivalent) consumed in the process.  The small EROI insert chart shows the huge decline since the 1950's.  At last count in 2007, the U.S. oil and gas industry was discovering five barrels of oil for the cost of one barrel (5/1 EROI) versus the 60+/1 EROI during the 1950's.

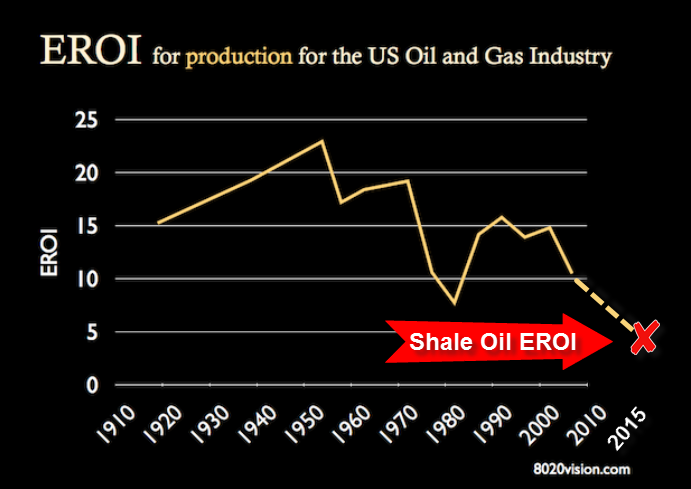
This next chart shows the Falling EROI of U.S. oil and gas production.  It peaked in 1950 at an EROI of 23/1 and trended downward to the 5/1 EROI for Shale Oil production today:
EROI Production

The data for the chart ended in 2007.  I added the dashed line showing the EROI of U.S. shale oil production.  The reason the EROI declined so much in the 1980's was due to huge increase in drilling activity as the price of oil surged during the 1970's.  Regardless, the EROI of U.S. oil and gas production has experienced a downward trend since the peak in 1950.

Simply put, as the EROI falls, there are less profitable barrels to run the U.S. economy.  Charles Hall recently stated that a modern society needed at least a 12/1 EROI of energy to sustain itself.  The Shale Oil Industry has provided a much needed liquid energy supply, but the 5/1 EROI of shale oil does not meet the minimum requirements of a modern society.

If we look at these two charts, we can see that EROI of U.S. oil discovery and production fell significantly since the 1950's.  This had a profound impact on the U.S. economy and outstanding debt.  Ever since the 1970's, top paying U.S. manufacturing jobs have been exported overseas.  It's no coincidence that this occurred right at the same time as the U.S. oil discovery and production EROI rapidly declined.  Again, please check the small EROI insert chart in the U.S. oil and gas discoveries graph.  You can see the collapse of the EROI more readily.

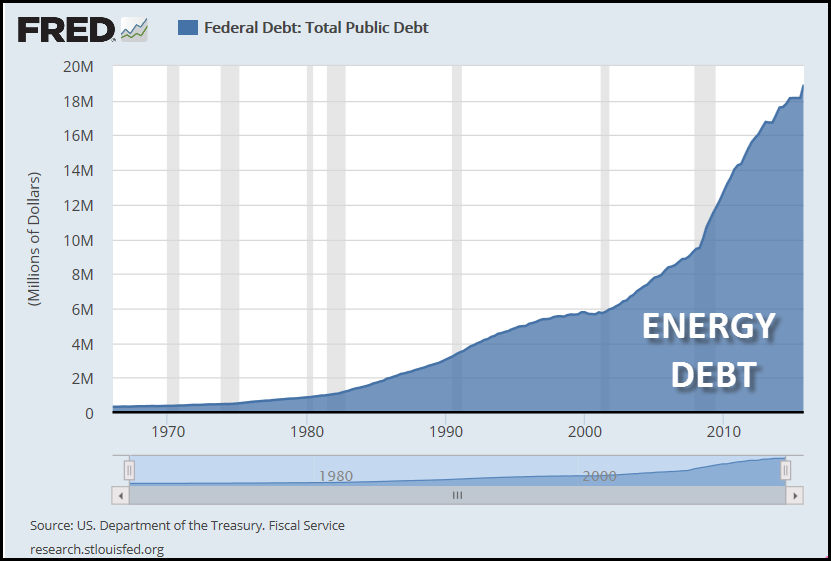
How did the Falling EROI impact the outstanding debt of the United States?  Please look at the following chart:
U.S. Debt

You will notice that the total U.S. debt started to increase in the 1970's and picked up considerably in the following decades.  I labeled the FRED chart as "ENERGY DEBT" because this is exactly what all financial debt should be called.  Energy has to be burned to create economic activity to pay back debt.  So, all financial debt is actually "ENERGY DEBT."

Why did U.S. ENERGY DEBT increase so much since the 1970's??  This was due to the falling EROI of U.S. oil discoveries and production.  Basically, the United States economy and system could no longer sustain itself as a commercially viable enterprise with the Falling EROI and declining domestic oil production, so it increased the amount of outstanding debt.  Thus, the increased debt is an inverse relationship to the Falling EROI and production of U.S. energy.

It's that simple folks.  However, most analysts don't understand this as they create all sorts of complicated models and charts showing how the U.S. will continue to grow well into the 22nd Century (2100).

Precious Metals Investors Are Mislead By Faulty Superficial Analysis

One of my readers forwarded the link to a recent article, Getting It Wrong On Silver by Keith Weiner.  Mr. Weiner is famous for his gold-silver basis charts which describes the inherent tightness or abundance of metal in the market.  While this is a valuable tool for traders who have a half a dozen monitors in front of them looking to scalp profits on short-term movements in the precious metals, it will be worthless for Americans who will be trying to survive as the U.S. oil supply contracts by 70-75% over the next decade.

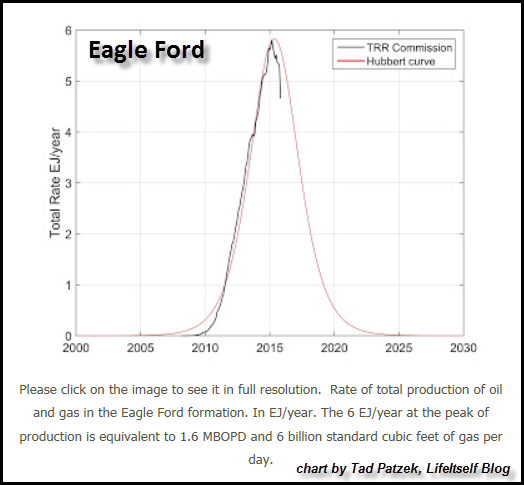
Here is a chart of the largest shale oil field in the United States, the Eagle Ford by Tad Patzek.  You can read more about it in my previous article, THE REAL REASON TO INVEST IN PRECIOUS METALS... It's The Fundamentals.
Eagle Ford Field Tad Patzek

As you can see, Mr. Patzek forecasts Eagle Ford oil production to collapse back to very little by 2020.  This is only four years away.  Again, if you check out the link above you can read his vast experience and background in Petroleum Geology.

Unfortunately, Mr. Weiner's gold-silver basis charting analysis wont put food on the table when the complex supply chain system disintegrates due to the collapse of U.S. energy production.  However, owning physical gold and silver at this time could help considerably.

Mr. Weiner brings up several NO-NO's written about silver in a Bloomberg article that is no longer available at the link he provided.   One of the items Mr. Weiner tries to debunk in his article is the subject of "STOCK to FLOWS."  Here is his commentary:

Mankind has been accumulating silver for many thousands of years. Unlike gold, some of it is consumed. Unlike any ordinary commodity, most of it is not. Economists call this the ratio of stocks to flows — inventories divided by annual production.


In gold and silver, stocks to flows is measured in decades. In ordinary commodities, it’s months. In wheat, crude oil, or lithium if inventories build up too much, that is called a glut. The price crashes until the glut is worked off.


There is no such thing as a glut in gold or silver, nor a shortage. This is part of what makes them money.

Mr. Weiner is making the point that there is no real shortage of silver or gold.  He states that the analysis showing a decline in global silver production is meaningless because there is so much above-ground available silver.  As he states, "Mankind has been accumulating silver for many thousands of years."

While Mr. Weiner is correct that Mankind has been accumulating a lot of silver for thousands of years, it has also been accumulating a massive amount of debt over the past 40 years.  When the Roman Empire collapsed, it may have debased its currency to continue business as usual as best it could, but it didn't have much debt.

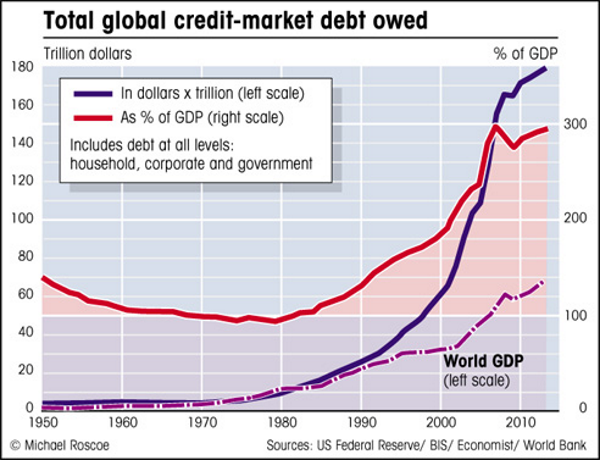
This is much different scenario for the U.S. and world today.  Here is a chart of total World debt:
Total world debt

Unfortunately, Keith Weiner doesn't factor in this debt when he produces his gold-silver basis charts.  I imagine Mr. Weiner believes this debt will continue to head exponentially until it reaches Mars or Pluto.

Think about this for a minute.  Gold and silver are real stores of wealth, while paper assets and debt's are ENERGY IOU's.  Moreover, most assets are really debts to be paid in the future.  Think about all the Pension Plans we are now hearing about that are underfunded.  How about the viability of Social Security in 5-10-20 years??  Or how about all the 401K's that Americans believe are going to be fully funded when they retire in say five or ten years??

How on earth do Americans think they will receive their monthly payment from a 401k, Pension plan, IRA or etc if U.S. energy production declines by 70- 75% in the next decade.  And don't forget about the falling EROI.

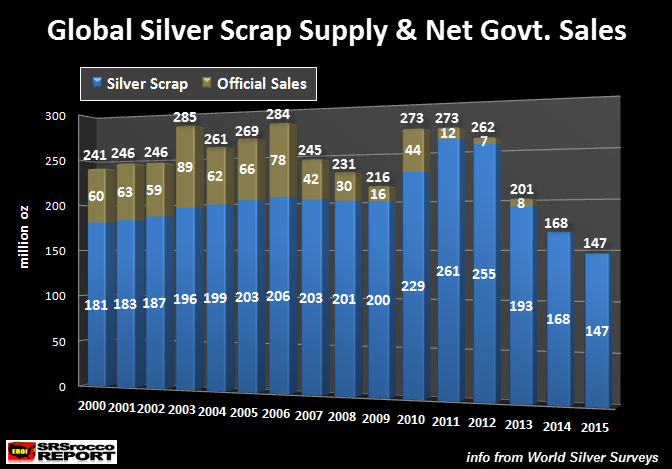
Okay, let's get back to silver.  Here is a chart I just made to show how much silver came on the market each year due to scrap supply and net Govt sales:
Global Silver Scap & Official Sales

You will notice a few interesting trends in the chart above.  First, total supply from these two sources peaked in 2003 at 285 million oz (Moz) and has been trending lower.  The majority of Government Silver sales came from China, Russia and India since 2000 (ironic aye, the very same countries acquring the most gold today).  However, Official Govt silver sales were ZIP in 2014 and 2015.

Secondly, even though the high silver price in 2011 and 2012 brought about a larger scrap supply, the total for those years didn't surpass 273 Moz.  In regards to total global above ground silver stocks, I have seen the following estimates by the CPM Group:

3 billion oz Silver bullion & coins

24 billion oz Jewelry, Decorative & Religious

27 billion oz Total

So, if we assume the 27 billion oz figure is correct of all the public and private held silver in the world, then in 2011 only 273 Moz of silver came into the market when the price nearly touched $50.  Thus, only 1% of total world STOCKS came into the market when the price of silver reached $50.  That is not an impressive figure at all if we are discussing silver stock to flows.

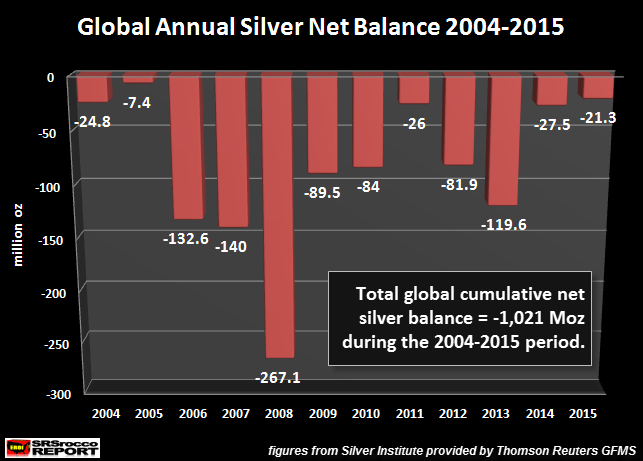
Of course there are likely other silver stocks we don't know about that have been supplementing the one billion oz cumulative global supply deficit since 2004.
Global Annual Silver Deficits

However, those stocks are likely declining as Central Banks are no longer dumping silver on the market.  This is also true for gold as well.

Truth be told, the STOCKS to FLOWS factor will become totally meaningless when investors start moving out of increasing worthless paper assets and into physical gold and silver to protect wealth due to the decline of U.S. and world energy production.

As I explained above, the Falling EROI has been creating havoc on the U.S. economy since the 1970's.  Americans have enjoyed a 40 year reprieve due to the U.S. Petro-Dollar arrangement and the exporting of high-paying manufacturing jobs overseas.  Unfortunately, this is not a sustainable business model.  Either is the $19+ trillion in debt.

Precious metals investors need to understand the difference between short-term superficial analysis that provides traders with scalping profits versus the mid to longer term fundamentals that suggest owning physical precious metals in the troubling times ahead.

As more investors wake up to the upcoming economic and financial collapse, the need to analyze the gold-silver basis will no longer be necessary or relevant.  Shortages of the precious metals will occur in the future (even though Mr. Weiner may disagree) as investors move into physical gold and silver to protect wealth.

Lastly, the days of earning interest, dividends or scalping profits are growing short.  Keep an eye on the Falling EROI and world energy production for the key going forward.

Please check back for new articles and updates at the SRSrocco Report.  You can also follow us at Twitter, Facebook and Youtube below:

SRSroccoTwitterFacebookYoutube

Friday, April 29, 2016

A Few Facts About Gold That Nay-Sayers Conveniently Ignore

Published here: http://redirect.viglink.com?u=http%3A%2F%2Fwww.zerohedge.com%2Fnews%2F2016-04-29%2Ffew-facts-about-gold-nay-sayers-conveniently-ignore&key=ddaed8f51db7bb1330a6f6de768a69b8

We  continue to see articles by so called “experts” trashing Gold and Silver as investments. Gold is everything from a “Pet Rock” to a “Dumb Investment” or “Barbarous Relic.”

Do these people even bother doing research? Or are they just stock shills?

First and foremost, you cannot compare Gold’s performance relative to stocks anywhere before 1967.

Why?

Because Gold was pegged to currencies up until that point. Any comparison of Gold’s performance relative to other asset classes prior to 1967 is completely misleading because Gold’s performance was limited by currency pegging.

However, once began to be de-pegged in 1967, the story changes.

As Bill King notes, Gold’s performance has absolutely DEMOLISHED that of stocks post 1967. The below chart normalizes both asset classes.

As you can see, even with Gold having lost nearly 40% of its value since 2011, and stocks soaring to all time highs over 2,100 on the S&P 500, the comparison isn’t even close.

This outperformance has continued recently despite the Fed juicing the market at every turn.

Between the year 2000 and today, stocks have been in two of the biggest stock bubbles in history. Over this time period the Fed has done almost nothing but prop stocks up by printing money or maintaining interest rates far below where they should be.

And yet, Gold has once again CRUSHED stocks’ performance. Again, the comparison isn’t even close (and that includes Gold’s terrible performance from 2011 onwards).

Despite these two facts, you rarely if ever see pro-Gold articles appear in the media.

It’s odd… for an asset class that less than 1% of investors actually own, “reporters” and “analysts” sure spend an awful lot of trashing it. How come they don’t spend an equal amount of time trashing uranium or other under-owned asset? Why spend so much time focusing on an asset that so few people even own?

Probably because:

1)   Gold doesn’t generate any revenue for financial institutions (brokers, investment managers, etc.)

2)   Gold doesn’t benefit the banks, as you can store it if your own safe.

3)   Gold and its performance run counter to the view that you can generate wealth via money printing.

At the end of the day, buying Gold represents pulling your money from the financial system… which is the last thing the Fed wants anyone to do.

Meanwhile, as Central Banks turn up the printing presses again, Gold is once again beginning to show signs of life, turning upwards against all major currencies.


We believe the next leg up is about to begin for Gold. Those who remember form the last Gold bull market in the ‘70s, it was the second leg of Gold’s bull market that saw the most gains.

From 1970 to 1974, Gold rose 550%. It then took two-year breather before beginning its second, much larger leg up. During that second leg, it rose over 900% in value.

If Gold were to stage a similar move now, it would rise to over $10,000 per ounce.

On that note…

We just published a Special Investment Report concerning a secret back-door play on Gold that gives you access to 25 million ounces of Gold that the market is currently valuing at just $273 per ounce.

The report is titled The Gold Mountain: How to Buy Gold at $273 Per Ounce

We are giving away just 100 copies for FREE to the public.

To pick up yours, swing by:

https://www.phoenixcapitalmarketing.com/goldmountain.html

Best Regards

Graham Summers

Chief Market Strategist

Phoenix Capital Research


Gold “Chart of The Decade” – Maths Suggest $10,000 Per Ounce Says Rickards

Published here: http://redirect.viglink.com?u=http%3A%2F%2Fwww.zerohedge.com%2Fnews%2F2016-04-29%2Fgold-%25E2%2580%259Cchart-decade%25E2%2580%259D-%25E2%2580%2593-maths-suggest-10000-ounce-says-rickards&key=ddaed8f51db7bb1330a6f6de768a69b8

Gold “Chart of The Decade” – Maths Suggest $10,000 Per Ounce Says Rickards

James Rickards, economic and monetary expert, joined Bloomberg’s Francine Lacqua on Tuesday to discuss the gold “chart of the decade”, his new book “The New Case for Gold,” why gold is money and why gold is going to $10,000/oz in the coming years.

gold chart
Gold in USD – 10 Years (GoldCore)

Francine generously acknowledged how Rickards was “bullish on gold for quiet some time and actually you have been proven right … it is the chart of the decade”. She said that this “has to do with inflation expectations, it has to do with currency but it is really at the end of the day just a haven so people pile into it – as much as they do yen …”

GOLD IS MONEY
Jim responded that

“Gold is a form of money and not an investment. As money it competes with other kinds of money — the dollar, euro, yen etc.. They’re like horses going around a racetrack – place your bets but you have a subjective preference for money. 

As investors are losing confidence in central banks … that’s what’s been going on and been clearly revealed. Central bankers have told me that they don’t know what they’re doing and they sort of make it up as they go along. They experiment.

President Evans of the Chicago Fed has said this and others have said it privately.

I spoke to Ben Bernanke and he described that everything he’s done was an experiment — meaning you don’t know what the outcome is.

So in that world where investors are losing confidence in central banks, gold does well.

Right now there are tens of trillions of dollars of sovereign debt with negative yields to maturity – bunds and JGBs..

Gold has zero yield.

Zero is higher than a negative 50 bps so gold is now the high yield asset in this environment.”

STOCKS HIGHER ON “FULL DOVE”
Regarding stocks, Rickards had this to say:

“Both gold and stocks are going up, and the reason stocks are going up is because Janet Yellen is going “full dove”. There’s nothing the stock market doesn’t like about free money. Plus negative interest rates might be on the table for next year.

That’s sort of bullish for stocks but it’s also bullish for gold.

Sometimes gold and stocks go up together and sometimes they don’t. There’s no long term correlation, but right now in a world of easy money and negative yields it’s good for both stocks and gold.”

GOLD AT $10K/oz
When asked for his price target for gold, Rickards says

“I have a technical level for gold, it is $10,000 U.S. per ounce. That amount gets bigger over time because it’s a ratio of physical gold to printed money. The amount of physical gold doesn’t go up very much, but printed money goes up a lot, so the dollar target goes up more over time because of all the money printing.

$10,000 U.S. per ounce is the implied non-deflationary price for gold. If you have to go back to a gold standard, or anything like it to restore confidence, that is the number you must have to avoid deflation.

So $10,000 per ounce is mathematically derived and is not a guess.”

INTEREST RATES and US ECONOMY
Rickards is asked what happens if Yellen tries to normalise rates and says

“If Janet Yellen begins to normalize then it would probably throw the U.S. into a recession. A 25 basis points hike in December threw the U.S. stock market into a 10% correction in the next two months.

The U.S. is hanging by a thread. It looks like first quarter GDP is going to come in at well below 1% according to the Atlanta Fed Tracker.

What’s the difference between -1% and 1%? Technically not much. One may be a technical recession and one is not, but growth is extremely weak. You don’t raise interest rates in a recession. You’re supposed to ease in a recession.

International spill over as well as the U.S. economy being fundamentally weak is the reason to not raise rates.

The time to raise rates was 2011 and that’s long gone. But two wrongs don’t make a right.”

SHANGHAI ACCORD and ‘SUPER MARIO’
“The Phillips Curve seems to have broken down — if it ever existed. The bigger play is the “Shanghai Accord” which came out of the G20 meeting in Shanghai, China in February 2016.

It’s like a secret Plaza Accord between the U.S. Fed, the Bank of England, the Peoples Bank of China, the European Central Bank and the Bank of Japan.

The evidence for a new secretive plaza accord is overwhelming. See here is the deal – China needs to ease. But the last two times China eased, August 2015 and December/January 2016, the U.S. stock market fell out of bed.

So how do you ease China without destroying the U.S. stock market?

So the answer is keep the dollar/yuan cross rate unchanged. Then ease in the U.S. dollar so that China goes along for the ride. At the same time tighten Japan and Europe, so you get a stronger yen and a stronger euro.

China is a larger trading partner for Japan and Europe than the U.S. is, so it’s a backdoor easing for China. Cross rates unchanged but China gets to ease.”

Lacqua wonders if Mario Draghi in the ECB would agree to that and Rickards concludes by saying that ‘Super Mario’ “is his favourite central banker”.

Watch the full interview here


Week’s Market Updates
Property Bubble In Ireland Developing Again

Silver Bullion “Momentum Building” As “Supply Trouble Brewing”

Cyber Fraud At SWIFT – $81 Million Stolen From Central Bank

Gold In London Vaults Beneath Bank of England Worth $248 Billion – BBC

Silver Prices Up 6% This Week and 25% YTD; Gold Up 1% This Week

Gold News and Commentary
Silver “will likely continue to be the surprise outperformer in 2016” said GoldCore (Reuters)
“Tempter tantrum in global markets today is quite worrisome” said GoldCore (Marketwatch)
Gold climbs after Fed, BOJ stand pat on policy (Reuters)
Gold powers higher as BOJ’s surprise inaction hurts the dollar (Mineweb)
Russia’s VTB aims to supply up to 100 tonnes of gold to China per year (Reuters)

Gross Warns Financial System Likely To Implode – (Bloomberg Video)
JP Morgan Sees Draghi as Buyer of Last Resort for Equities (Bloomberg)
Venezuela Doesn’t Have Enough Money to Pay for Its Money (Bloomberg)
America’s earnings recession just got worse (CNN)
Germany’s Merkel warns of risks to banks from low interest rates (Reuters)
Read More Here

Protecting_Your_Savings_in_the_Coming_Bail_In_Era_-_Copy-3.jpg   Essential_Guide_to_Storing_Gold_in_Singapore.jpg   7_Key_Storage_Must_Haves.png

Read Our Most Popular Guides in Recent Months

The Deutsche Bank Settlement is Meaningless

Published here: http://redirect.viglink.com?u=http%3A%2F%2Fwww.zerohedge.com%2Fnews%2F2016-04-28%2Fdeutsche-bank-settlement-meaningless&key=ddaed8f51db7bb1330a6f6de768a69b8


The Deutsche Bank Settlement is Meaningless

Written by Jeff Nielson (CLICK FOR ORIGINAL)


There has been considerable hoopla and celebration,following Deutsche Bank’s legal settlement , in a U.S.-based litigation against this Big Bank regarding precious metals manipulation. The enthusiasm surrounds Deutsche Bank’s pledge to “cooperate” in providing evidence to be used against the other defendants in that litigation: HSBC and the Bank of Nova Scotia (and possibly UBS, as well).


It is painful to be a naysayer here. The extreme, perennial, manipulation and suppression of precious metals prices is one of the more odious blotches on what we call “markets”. However, there is unfortunately no basis for renewed optimism that this current litigation will have any meaningful impact on precious metals manipulation – with respect to either silver or gold.


There are several reasons for not considering this to be the turning point in precious metals markets which several commentators have suggested. The most important reason here is the subject matter of the manipulation itself. The lawsuit which reaped this settlement is based exclusively on manipulation of the silver fix (and gold fix).


As has been explained previously, manipulation of the silver and gold “fix” is only the tip of the iceberg regarding the manipulation of precious metals markets. Of far greater significance are the following categories of fraud and manipulation:

1) Naked shorting

2) Bullion “leasing”

3) Algorithm manipulation


Naked shorting is an endemic form of fraud in our pseudo-markets, due to lack of regulation and enforcement of this crime. We can only assume that this is particularly egregious in precious metals trading, as the short positions in these metals is grossly disproportionate to shorting activity anywhere else in the spectrum of commodities.


So-called bullion leasing is a form of fraud and manipulation which has been discussed by many other commentators, as well as in previous commentaries. “Gold generates no income.” This tautology is true with respect to any commodity.


The only way to produce revenues from any commodity is to use it (i.e. consume it), or sell it. In either case, it requires surrendering possession. Consequently, there can be no legitimate business purpose in “leasing” any commodity, only nefarious ones. In the case of (central bank) bullion leasing, the fraudulent modus operandi is well known.


…central banks stand ready to lease gold in increasing quantities should the price rise.

- Testimony of [Federal Reserve] Chairman Alan Greenspan , July 24th, 1998


So what? Central banks “stand ready” to temporarily transfer possession of their gold to some third party. In what way does that counteract a rising gold price, the clear intent of Chairman Greenspan’s testimony? There is no legitimate way in which such a transaction could impact bullion markets.


The illegitimate way is well known. Western central banks “lease” their gold to “traders” (i.e. the Big Banks). The bankers then short the gold onto the market (manipulating the price lower), thus requiring them to transfer permanent ownership of that gold, should the party on the other end of the transaction take delivery of the metal being traded.


The gold is gone, forever, but it remains on the books of the central banks: the phantom “gold reserves” of which Western governments continue to boast. Countless, thousands of tonnes of gold have been leased onto the market during this era of manipulation. We don’t know the precise level of fraud with respect to central bank bullion “leasing”, because (of course) these institutes of financial crime permit no full, public audits of their books, ever.


Algorithm manipulation is undoubtedly now the most important category of precious metals manipulation, just as it is with respect to price manipulation throughout our markets. This has been well established in previous commentaries.


So-called “HFT trading” (i.e. computerized algorithm trading) now dominates all trade activity, in all markets. The evidence of manipulation, particularly in U.S. markets, has now been clearly revealed and defined through research into this form of market crime. That research showed that:

a) 75% of all U.S. equities were subjected to significant levels of algorithm price manipulation.

b) This manipulation is not only endemic, it is systemic. This algorithm manipulation was strongly “correlated”, meaning it was being controlled by a single Invisible Hand – the Big Bank crime syndicate which regular readers know as the One Bank.


Throughout the last, five years of relentless price suppression, we have seen clear technical “break-outs” in the price of gold and silver, only to see prices quickly reverse.


It is true that even legitimate markets occasionally send false (technical) signals. However, both gold and silver have been priced at only small fractions of any minimum, rational price which we could possibly assign. When strong, bullish technical indicators are accompanied by strongly bullish fundamentals, legitimate markets never reverse in such a manner.


This is why the mainstream media (a tentacle of the One Bank) invests so much time and effort with their own, gibberish analysis of gold and silver, creating their own, bogus “fundamentals” which they then hype as an “explanation” of the absurdly fraudulent prices of silver and gold.


Note additionally the pattern of silver trading over the past 5 years. Silver is both a much smaller market than the gold market, with much more volatile demand. For both of those reasons, the price of silver must be more volatile than the price of gold, yet over the past five years we see precisely the opposite pattern.


We see a pseudo-market which is being ruthlessly suppressed. Further indication of this comes by looking at the technical break-outs in the price of silver versus break-outs in the gold pseudo-market. Silver break-outs are instantly attacked, and the price is hammered lower, while gold break-outs occasionally are allowed to gather a little momentum, before then being illegally reversed. Indeed, it is precisely this previously demonstrated omnipotence which prompted the warning that the current “rally” in gold and silver is a fake-rally.


The fact that silver is held in a much tighter choke-hold reflects the differences in the fundamentals of these metals. Physical inventories and stockpiles of silver are undoubtedly much smaller than those of gold, in relative terms. The price of silver has been suppressed to a much more extreme degree. This means that the upward price-pressure on silver is much greater than with gold, and the capacity of the “market” to withstand any stampede of bullish demand is much more limited.


The Big Bank crime syndicate is much more afraid of silver than gold, and we see this clearly reflected in the pattern of price manipulation. The price of silver is never allowed to gain momentum, for fear that once “lift off” was achieved with silver that there would be no way to reverse either a price spiral, nor prevent some final, catastrophic implosion of inventories.


This brings us to the silver fix, and the Deutsche Bank settlement. The silver fix and gold fix were never anything more than minor tools of manipulation. At two moments each day; the banking crime syndicate “fixes” gold and silver prices. This is useful for defrauding contracts based upon the prevailing “fix” in gold or silver, but it has no significant impact on overall price manipulation.


Exposing such manipulation will do nothing toward preventing the continued, systemic manipulation of gold and silver prices, via the much more potent weapons of naked shorting, bullion leasing, and algorithm manipulation. Deutsche Bank was never accused of crimes of this nature in this lawsuit, thus its “cooperation” does not extend to providing information about such manipulation. However, by settling its own suit, acknowledging its liability, and “confessing” the manipulation of the gold-fix and silver-fix by other Tentacles, the One Bank can pretend that “manipulation” has now been eradicated from these markets.


This brings us to the final reason why the Deutsche Bank legal settlement is (unfortunately) much ado about nothing. It is the settlement of a lawsuit, not a conviction for the crime of illegally manipulating the gold and silver pseudo-markets. Deutsche Bank acknowledged civil liability for its actions, not criminal guilt.


These fix-manipulation lawsuits were launched in both the United States and Canada. Do we see the pseudo-regulators or pseudo-justice officials in either Canada or the U.S. announcing (criminal) investigations of the obvious crime for which Deutsche Bank has acknowledged its culpability? No.


Any real “investigation” might stumble upon the more potent forms of price manipulation discussed previously, and have some real, lasting impact on the serial manipulation of the prices of these metals. Civil lawsuits, no matter what their outcome, have no lasting impact on such systemic criminal activity. All that the victims of manipulation can do is launch additional suits in the future, since “justice” is a commodity which no longer exists in markets – the playground of the Big Bank crime syndicate.


As regular readers are already aware, the One Bank is now able to counterfeit its bogus “Monopoly money” in literally infinite amounts. No matter how much of its worthless confetti it is forced to shower upon litigants (now or in the future),such lawsuits could never have any deterrent effect on these financial crimes.


Even more appalling, when the Big Banks are actually caught-and-convicted perpetrating one of their serial Mega Crimes, such convictions never provide any actual law enforcement. A token “fine” is paid, and then the Big Banks go right back to committing the same crimes. Indeed, the U.S. Department of (pseudo) Justice has now formally proclaimed that it will never punish these corporations for their corporate crimes.


In the face of such systemic, unobstructed criminality, the token “victory” in an aspect of precious metals price-manipulation which has little overall relevance is trivial. Real victories will only come with real justice. The latter no longer exists in our corrupt nations, thus we should not be holding our breath for the former.


Please email with any questions about this article or precious metals HERE


The Deutsche Bank Settlement is Meaningless

Written by Jeff Nielson (CLICK FOR ORIGINAL)

Thursday, April 28, 2016

Gold and Silver Update - It's Game On!

Published here: http://redirect.viglink.com?u=http%3A%2F%2Fwww.zerohedge.com%2Fnews%2F2016-04-27%2Fgold-and-silver-update-its-game&key=ddaed8f51db7bb1330a6f6de768a69b8


Gold and Silver Update - It's Game On!

Posted with permission and written by Sprott USA (CLICK FOR ORIGINAL)


Gold and Silver Update


Gold continues to consolidate. Two months of sideways price action is proving the yellow metal’s early-year gains were justified while setting the foundation for another move up.


That move will require some kind of impetus and there are many options to provide the push: more stimulus announcements in Europe or Japan, weak Q1 earnings, increasing inflation expectations, rising general economic uncertainty, US dollar weakness, and interest rate roulette, to name a few.


We don’t know if these things will transpire, let alone when. The US dollar is certainly declining, if in fits and starts:


 [1]

That helps gold, from both the fundamental angle that gold is priced in greenbacks and the investment rationale that a declining greenback encourages savers to find another safe haven hideout for their savings.


But a declining dollar is only one cog in a machine driving investor interest towards gold. Another is the fact that super low interest rates have removed investors’ go-to tool for hedging their stock portfolios: bonds.


No matter what you think the odds are of a recession in the near to medium term, the fact is we are in uncharted waters. Very low or zero to even negative interest rates had their intended effect, which was to force savers and investors into riskier assets like bonds and equities. That created a seven-year bull market in equities and bonds – but one not representative of the actual economy, which remained stagnant.


That is what already happened. Of interest now is what will happen next.


Bonds have long been the go-to hedge against equities. Bonds are supposed to rise in price when recessionary periods push equities down, because recessions prompt central banks to lower interest rates and that lifts bond prices.


But how’s that supposed to work when interest rates are already rock bottom?


Bonds will not hedge stocks if we enter a recession because central banks can’t do anything to support bonds. That means investors will look elsewhere for a hedge. Gold will be a natural conclusion.


As John Hathaway of Tocqueville Asset Management calculated, if investors were to increase their gold allocation from 0.55% (the current level) to 1.55%, that would represent 56,075 tonnes of demand. That is far more gold than is currently available in London. In fact, a 0.1% increase swamps the supply of physical gold.
[2]


That is the kind of logic that backs the idea that gold has a good run ahead.


Gold moving sideways and consolidating supports the view that gold’s run has truly begun. The way equities are acting adds weight.


Gold stocks outperform gold at the start of a bull cycle. Take a look back to the last cycle: gold bottomed in April 2001 but then ascended slowly, not making a new 52-week high until early 2002 and not establishing a higher high until almost the end of that year. Meanwhile, gold stocks as per the HUI more than doubled during 2002 while many juniors moved far more.


Gold stocks outperform the yellow metal the most at the start of the bull cycle. We are seeing that kind of outperformance now.


Then there’s silver, which has finally started to move.


  It doesn’t look like much on the five-year chart, but silver seems to have carved out a bottom. It is up 21% this year, making it the best-performing metal.


And silver has more ground to regain. Gold may have lost 45% in the bear market, but silver lost more than 70%.


The fact that silver is moving now matters. Silver never moves lock step with gold. When uncertainty prompts investors to seek out safe havens, they look to gold long before silver because gold is a far more straightforward safe haven. Silver, by contrast, is also an industrial metal, which means demand waxes and wanes more with economic demand.


However, after some time silver’s safe haven status starts to catch up. And once it starts to look like a safe haven, it acts increasingly so. That process usually starts when gold is consolidating its first big move and preparing to take out its next resistance.


In other words: we’re seeing gold consolidate, which gives confidence in the new price range, and gold is trailing gold equities, which is precisely the pattern we see to start new bull markets. Silver’s recent move only confirms the pattern.


Explorers, miners, and resource investors have been waiting for this pattern to emerge for years. With evidence of a new bull market mounting, they are getting busy.


Here’s a good comparison: in the fourth quarter of last year, miners and explorers raised a measly $565 million. The average placement totaled just $3.3 million.


In the first quarter of this year, the sector has raised $3.5 billion and the average size rose to $23 million. [3]


That’s a massive change. Granted, a few huge raises tipped the scale, including Franco Nevada’s $1 billion, Silver Wheaton’s $623 million, and Goldcorp’s $250 million.


But the money still matters.


For one, royalty and streaming companies like FNV and SLW put capital to use by investing in other assets and companies. That helps the whole sector.


For another, doozies aside the sector still raised a lot of cash and about a fifth of the financings went to explorers and developers. That is significant – in the depths of the bear market, explorers just didn’t have access to capital.


Then there’s the deal flow. The quarter saw several big deals: Tahoe buying Lake Shore Gold, Endeavour buying True Gold, and Newcastle buying Catalyst Copper. There were a good number of smaller deals as well: Probe Metals and Adventure Gold merged, Kootenay Silver took over Northair Silver, and First Mining Finance bought both Clifton Star Resources and the Pitt project from Brionor Resources, among others.


Also really interesting are the moves by majors and mid-tiers to acquire stakes in smaller companies. Goldcorp’s move on Gold Standard Ventures is one example (and it prompted Oceanagold to put more money into GSV to maintain its stake); Oceanagold’s investment in NuLegacy is another.


A favorite question during the bear market was: what will it take to bring mining back to life?


Our answer was always the same: investors have to make money.


In that sense, a mining revival becomes a self-fulfilling prophecy. A bit of recovery gives companies confidence to raise capital. Capital enables exploration, development, and deals, which in turn adds life to share prices.
Reinvigorated share prices means more financings, more activity and happier investors.


It’s game on.


Please email with any questions about this article or precious metals HERE


Gold and Silver Update - It's Game On!

Posted with permission and written by Sprott USA (CLICK FOR ORIGINAL)


Silver Prices: Last Time This Happened, Silver Soared 1,328%

Published here: http://redirect.viglink.com?u=http%3A%2F%2Fwww.profitconfidential.com%2Fsilver%2Fsilver-prices-last-time-this-happened-silver-soared-1328-percent%2F&key=ddaed8f51db7bb1330a6f6de768a69b8

2 Charts You Shouldn’t Look Away From if You Own Silver
Put in simple words, if you are not paying attention to silver prices now, you may be kicking yourself a few years from today. The gray precious metal has shown solid gains so far in 2016 and more of the same could follow.

Before going into details, just looking at the following daily silver price chart, pay close attention to the red and blue lines.

Silver prices currently trade above their 200-day moving average (red line) and 50-day moving average (blue line).

You see, in technical analysis terms, these.

The post Silver Prices: Last Time This Happened, Silver Soared 1,328% appeared first on Profit Confidential.

Wednesday, April 27, 2016

Silver “Momentum Building” As “Supply Trouble Brewing”

Published here: http://redirect.viglink.com?u=http%3A%2F%2Fwww.zerohedge.com%2Fnews%2F2016-04-27%2Fsilver-%25E2%2580%259Cmomentum-building%25E2%2580%259D-%25E2%2580%259Csupply-trouble-brewing%25E2%2580%259D&key=ddaed8f51db7bb1330a6f6de768a69b8

Silver “Momentum Building” As “Supply Trouble Brewing”

Silver bullion prices are likely to rise further as there is “supply trouble brewing” as strong industrial and investment demand are confronted by declining supply.

silver coins

“There are signs that this year could be a pivotal year for the silver market,” New York-based CPM Group said in its “Silver Yearbook 2016.”

“Silver mine supply is forecast to decline for the first time in 2016, since 2011,” CPM said, noting scheduled closures and planned production cutbacks.

More good news for silver bulls: there’s supply trouble brewing.

Output from mines will fall for the first time since 2011, while demand for the metal in uses including industrial products and jewelry is heading for a fourth straight gain, supporting prices, according to CPM Group. The market is entering what is “likely to be a pivotal year,” the New York-based researcher said in its “Silver Yearbook 2016” reported Bloomberg.

Bloomberg said that “momentum is building” as silver mine output is “seen falling for first time since 2011” at the same time that “investor holdings in silver ETFs rise at triple gold’s pace”.

SilverCoinsHeader (2)

CPM forecast global silver mine production will fall 2.4 percent to 784.8 million ounces in 2016, with output declining in Mexico and Australia but rising in Peru and China. Fabrication demand was seen rising 1.6 percent from 2015 to 889.7 million ounces, with increases in jewelry, silverware, electronic, battery and solar panel manufacturing.

CPM forecast a global deficit of 44.7 million ounces in 2016, much larger than the 11.9-million-ounce deficit in 2015 and the biggest deficit since 2005.

CPM expect demand for silver coins to fall to 142.8 million ounces this year, down from record levels of 145.7 million ounces in 2015. Silver coin demand in China, however, was forecast to rise to 24.5 million ounces from 22.3 million ounces in 2015.

Silver had its biggest quarterly rise in nearly 30 years in the first three months of 2016 as ETF investors, buying of silver coins (now VAT free in UK and EU) and bars and speculators in the futures market pushed prices higher.

Silver prices fell to $13.60 an ounce in December, the lowest in more than six years. Silver has since rallied nearly 20 percent in the first three weeks of April to an 11-month high at $17.70 an ounce and has entered a new bull market.


Recent Market Updates
Cyber Fraud At SWIFT – $81 Million Stolen From Central Bank

Gold In London Vaults Beneath Bank of England Worth $248 Billion – BBC

Silver Prices Up 6% This Week and 25% YTD; Gold Up 1% This Week

Gold Price Set To Push Higher As Inflation Picks Up – RBC

Silver Bullion “Has So Much More to Give” – 5 Must See Charts Show

China Gold Bullion Yuan Trading To Boost Power In Gold and FX Markets

Gold News and Commentary
“We believe the recovery in the U.S. is more fragile than is acknowledged” (GoldCore in Marketwatch)
Silver Supply Trouble Shows Why Rally Momentum Is Building (Bloomberg)
China’s gold imports from Hong Kong rise to 3-month high – (Reuters via Biz Recorder)
China’s Gold Imports Jump on Investment Demand as Price Falters (Bloomberg)
Silver may touch as high as $20 an ounce in near term – Deutsche Bank (Metal.com)

Gold Has “Chart of Decade” – Going to $10,000/oz – Rickards (Boomberg)
Depression, Debasement, & 100 Years Of Monetary Mismanagement (Zero Hedge)
Pimco Economist Has A Stunning Proposal To Save The Economy: The Fed Should Buy Gold (Zero Hedge)
Why a Collapse Is “Practically Unavoidable” (Casey Research)
Do Old Indicators Matter Or Is Physical About To Overrun Paper? (Dollar Collapse)
Read More Here

Gold Prices (LBMA)
27 April: USD 1,244.75, EUR 1,100.79 and GBP 853.58 per ounce
26 April: USD 1,234.50, EUR 1,093.46 and GBP 847.28 per ounce
25 April: USD 1,230.85, EUR 1,094.08 and GBP 853.79 per ounce
22 April: USD 1,245.40, EUR 1,104.34 and GBP 868.73 per ounce
21 April: USD 1,257.65, EUR 1,113.21 and GBP 877.01 per ounce

Silver Prices (LBMA)
27 April: USD 17.34, EUR 15.34 and GBP 11.87 per ounce
26 April: USD 16.95, EUR 15.02 and GBP 11.64 per ounce
25 April: USD 16.86, EUR 14.98 and GBP 11.67 per ounce
22 April: USD 17.19, EUR 15.26 and GBP 11.96 per ounce
21 April: USD 17.32, EUR 15.31 and GBP 12.05 per ounce


www.GoldCore.com 

Silver, More Rare Than the Market Understands

Published here: http://redirect.viglink.com?u=http%3A%2F%2Fwww.zerohedge.com%2Fnews%2F2016-04-26%2Fsilver-more-rare-market-understands&key=ddaed8f51db7bb1330a6f6de768a69b8


Keith Neumeyer: Silver, More Rare Than the Market Understands

Posted with permission and written by Rory Hall, The Daily Coin (CLICK FOR ORIGINAL)


Keith Neumeyer: Silver, More Rare Than the Market Understands - The Daily Coin


For the past three plus years, I have been asking how silver and gold have always been available when we can see stress in the markets all through the supply chain. According to several prominent analyst, and producers, global silver and gold production declined in 2015. In Mexico alone silver production is down approximately 6%. According to some of the information that we reviewed, here at The Daily Coin, silver production increased due to the low price of silver.

Silver has become a just-in-time product. With Eric Sprott, Sprott Asset Management, recently announcing a $5 billion addition of physical silver to the PSLV ETF we shall see what is happening with the silver market at the institutional level.

Keith Neumeyer also explains how a large electronics manufacturer recently contacted his company, First Majestic, regarding the acquisition of silver for their manufacturing processes. This screams of a very, very tight supply of silver in large quantities. Where is metal coming from?

I sat down with Keith Neumeyer, CEO, First Majestic and Chairman, First Mining Finance, to get his take on Duestche Bank admitting to rigging the silver and gold markets and naming both HSBC and Scotia-Mocatta as being involved with the scheme. The important part is Duestche Bank naming other bullion banks as being part of the scheme.

Keith also shares with us how the gold/silver ratio is so far out balance that when it begins to correct that it will be breathtaking in the way it unfolds. Can you imagine a 8:1 gold/silver ratio price? Currently, the ratio is 75:1. Meaning the price of gold is 75 times higher than silver even though silver is mined at a 10:1 ratio to gold.

Let’s listen to Mr. Neumeyer and allow him to explain the current condition of the market and how the mining production will continue to decline, thereby, putting quality mining operations in the drivers seat for the unfolding next leg of the precious metals bull market.


Please email with any questions about this article or precious metals HERE


Keith Neumeyer: Silver, More Rare Than the Market Understands

Posted with permission and written by Rory Hall, The Daily Coin (CLICK FOR ORIGINAL)


Tuesday, April 26, 2016

Cyber Fraud At SWIFT – $81 Million Stolen From Central Bank

Published here: http://redirect.viglink.com?u=http%3A%2F%2Fwww.zerohedge.com%2Fnews%2F2016-04-26%2Fcyber-fraud-swift-%25E2%2580%2593-81-million-stolen-central-bank&key=ddaed8f51db7bb1330a6f6de768a69b8

Swift, the vital global financial network that western financial services companies, institutions and banks use for all payments and transfer billions of dollars every day, warned its customers yesterday evening that it was aware of cyber fraud and a number of recent "cyber incidents” where attackers had sent fraudulent messages over its system and $81 million was apparently stolen from a central bank.

SWIFT_LogoSWIFT (Wikipedia)

As reported by Reuters, the disclosure came as law enforcement agencies investigate the February cyber theft of $81 million from the Bangladesh central bank account at the New York Federal Reserve Bank. Swift has acknowledged that the scheme involved altering Swift software on Bangladesh Bank’s computers to hide evidence of fraudulent transfers.

Yesterday’s statement from Swift marked the first acknowledgement that the cyber attack on  the New York Federal Reserve Bank was not an isolated incident but one of several recent criminal schemes that aimed to take advantage of the global messaging platform used by some 11,000 financial institutions.

“Swift is aware of a number of recent cyber incidents in which malicious insiders or external attackers have managed to submit Swift messages from financial institutions’ back-offices, PCs or workstations connected to their local interface to the Swift network,” the group warned customers.

The warning, which Swift issued in a confidential alert sent over its network, did not name any victims or disclose the value of any losses from the previously undisclosed attacks.

Swift, or the Society for Worldwide Interbank Financial Telecommunication, is a co-operative owned by 3,000 financial institutions. Also, Swift released a security update to the software that banks use to access its network to thwart malware that security researchers with British defense contractor BAE Systems said was probably used by hackers in the Bangladesh Bank heist.

Cyber security experts said more attacks could surface as SWIFT's banking clients look to see if their SWIFT access has been compromised.

Shane Shook, a banking security consultant who investigates large financial crime, said hackers were turning to SWIFT and other private financial messaging platforms because such attacks can generate more revenue than going after consumers or small businesses.

"These hacks specifically target financial institutions because smaller efforts result in much larger thefts," he said. "It's much more efficient than stealing from consumers."

Full Reuters article is here

We have for some time warned of the risks posed by cyber fraud and war to banks, savings and indeed investments. The apparent theft of $81 million from a central bank from an account at the New York Federal Reserve shows this.

Cyber theft is a real risk for all digital or virtual wealth today – whether that be digital bank accounts and deposits or electronic stock and other exchanges.

Fintech solutions involving the vitally important blockchain cometh and not before time. However, many of these solutions are also vulnerable in the short term as the nascent industry grows and the best solutions survive and thrive and less safe ones are slowly found out by the market and disappear.

The risks posed to bank deposits, markets and indeed all online investments and savings by hacking, cyberterrorism and cyberwar remains not understood.

blockchain

Given these real risks, tangible gold becomes not important but a vital means of preserving wealth. Physical gold coins and bars, due to their tangible nature, are not vulnerable to crises that may afflict electronic digital currency and other digital wealth.

Those who hold physical gold and silver coins and bars outside the banking system as an insurance policy would certainly weather the storm better than those who do not.

The hope is that these risks will not materialise. Hope is not a strategy. We believe it is prudent to be aware of and take appropriate measures to protect your wealth.

Our modern western financial system with its massive dependency on single interface websites, servers and the internet faces serious risks that few analysts have yet to appreciate and evaluate. These also pose risks to digital gold providers who do not allow clients to interact and trade on the phone and are solely reliant on online trading platforms.

Jim Rickards, the leading expert on currency wars and risks posed by cyber fraud to people's, company's and indeed nation's wealth commented to GoldCore about the cyber theft:

"Bangladesh is one of the poorest countries in the world. $100 million of their money disappeared. The money was on deposit with the Federal Reserve Bank of New York, the safest bank in the world. The culprits hacked SWIFT, one of the most secure message traffic systems in the world. If the Fed and SWIFT aren't safe, nothing is safe. If Bangladesh had held physical gold, they would still have their money. The case for owning gold in an age of cyber-financial threats is compelling."


Recent Market Updates

Gold In London Vaults Beneath Bank of England Worth $248 Billion – BBC

Silver Prices Up 6% This Week and 25% YTD; Gold Up 1% This Week

Gold Price Set To Push Higher As Inflation Picks Up – RBC

Silver Bullion “Has So Much More to Give” – 5 Must See Charts Show

China Gold Bullion Yuan Trading To Boost Power In Gold and FX Markets

Marc Faber: “Messiah” Central Banks Helicopter Money Printing “Will Not End Well”

Gold News and Commentary
Gold ends higher ahead of central bank meetings (Marketwatch)
Gold climbs as dollar lends support ahead of Fed meeting (Reuters)
Gold Rises, Copper Falls as U.S. Home Sales Sag a Third Month (Bloomberg)
Sales of New U.S. Homes Fall for a Third Month on Slump in West (Bloomberg)
China debt load reaches record high as risk to economy mounts (FT via CNBC)

Macro picture sees precious metal shine (FT Adviser)
Gold, already on its way up, may head even higher: Technician (CNBC)
World Witnessed Socialism’s Death … Central Banking Is Next (Gold Seek)
Depression, Debasement, & 100 Years Of Monetary Mismanagement (Zero Hedge)
When will the Fed stop propping up the US stockmarket? (Money Week)
Read More Here

Gold Prices (LBMA)
26 April: USD 1,234.50, EUR 1,093.46 and GBP 847.28 per ounce
25 April: USD 1,230.85, EUR 1,094.08 and GBP 853.79 per ounce
22 April: USD 1,245.40, EUR 1,104.34 and GBP 868.73 per ounce
21 April: USD 1,257.65, EUR 1,113.21 and GBP 877.01 per ounce
20 April: USD 1,247.75, EUR 1,098.09 and GBP 867.45 per ounce

Silver Prices (LBMA)
26 April: USD 16.86, EUR 14.98 and GBP 11.67 per ounce (Not updated yet)
25 April: USD 16.86, EUR 14.98 and GBP 11.67 per ounce
22 April: USD 17.19, EUR 15.26 and GBP 11.96 per ounce
21 April: USD 17.32, EUR 15.31 and GBP 12.05 per ounce
20 April: USD 16.97, EUR 14.93 and GBP 11.81 per ounce

Protecting_Your_Savings_in_the_Coming_Bail_In_Era_-_Copy-3.jpg   Essential_Guide_to_Storing_Gold_in_Singapore.jpg   7_Key_Storage_Must_Haves.png


Read Our Most Popular Guides in Recent Months

Monday, April 25, 2016

Gold In Vaults Beneath Bank of England Worth $248 Billion?

Published here: http://www.zerohedge.com/news/2016-04-25/gold-vaults-beneath-bank-england-worth-248-billion

The gold bullion or “hidden gold mine” of various nation’s gold reserves stored in the vaults beneath the Bank of England have been covered by the BBC:

Under London’s streets lies a hidden gold mine.


It stretches across more than 300,000 square feet under the City, the finance quarter in the heart of Britain’s capital. There, beneath the pavement and commuters of Threadneedle Street, lies a maze of eight Bank of England gold vaults – each stacked with gold bars worth a total sum of around £141 billion ($200 billion).


gold_bullion_BOE
Stacks of gold bars are arranged on shelves in the Bank of England’s vaults (Credit: David Levenson/Alamy)


The bars sit on rows of blue numbered shelves. Every bar weighs precisely 400 troy ounces (about 12kg), making each currently worth some £350,000 ($500,000), comfortably more than the average price of a house in the UK. Each bar looks subtly different depending on where it was refined. Some bars have sloping edges to make them easier to pick up; others look more like a loaf of bread.


There is no smell here: metal has none. There is no noise, either, on account of the vaults’ thick concrete walls.

What there is, however, is one of the world’s most important traded assets. Deals are still done in gold in almost every country in the world. Its price is a crucial barometer for consumer confidence. Prices rise when markets are uncertain, and before US elections – like now.


Read full article here


Recent Market Updates

 Silver Prices Up 6% This Week and 25% YTD; Gold Up 1% This Week

Gold Price Set To Push Higher As Inflation Picks Up – RBC

Silver Bullion “Has So Much More to Give” – 5 Must See Charts Show

China Gold Bullion Yuan Trading To Boost Power In Gold and FX Markets

Marc Faber: “Messiah” Central Banks Helicopter Money Printing “Will Not End Well”


Gold News and Commentary
Gold marginally higher ahead of central banks this week (Bloomberg)
Metals hold up in high ground but may need to consolidate (Bullion Desk)
Gold hidden in secret vaults beneath the Bank of England worth $248bn (Independent)
One fifth of the world’s gold is buried in London (The Sun)
Building’s rent can be based on gold prices (Dispatch)

Silver’s New Bull Market (Zeal LLC)
Why Silver May Rally to $25: CPM Group -Video – (Fortune)
Britain should pay more attention to Eurozone crisis (Telegraph)
Gold has everything in its favor – Rally has legs (Marketwatch)
Resurgence Of Gold & Looming “Run On Cash” – Bass (Zerohedge)
Read More Here


Gold Prices (LBMA)
25 April: USD 1,230.85, EUR 1,094.08 and GBP 853.79 per ounce
22 April: USD 1,245.40, EUR 1,104.34 and GBP 868.73 per ounce
21 April: USD 1,257.65, EUR 1,113.21 and GBP 877.01 per ounce
20 April: USD 1,247.75, EUR 1,098.09 and GBP 867.45 per ounce
19 April: USD 1,241.70, EUR 1,095.18 and GBP 867.01 per ounce

Silver Prices (LBMA)
25 April: USD 16.86, EUR 14.98 and GBP 11.67 per ounce
22 April: USD 17.19, EUR 15.26 and GBP 11.96 per ounce
21 April: USD 17.32, EUR 15.31 and GBP 12.05 per ounce
20 April: USD 16.97, EUR 14.93 and GBP 11.81 per ounce
19 April: USD 16.62, EUR 14.67 and GBP 11.57 per ounce


silver_britannias
Buy Silver Coins VAT Free – Delivery In UK and EU

Silver Prices: Silver Bullion Could Soar 147% in 2016

Published here: http://www.profitconfidential.com/silver/silver-prices-silver-bullion-could-soar-147-percent-in-2016/

Silver may not be as scarce as gold but it has become much more attractive to investors. While silver prices recently soared to an 11-month high, silver continues to provide investors with more upside potential than gold.
Silver Prices Rising on Trojan Stock Market
After a record four consecutive years of declines, silver has been rewarding precious metal bulls in 2016. Silver prices have been on a tear in 2016, and recently hit an 11-month high. Currently exchanging hands at around $17.00 an ounce, silver prices are up 23% year-to-date.

Silver has turned bullish for two.

The post Silver Prices: Silver Bullion Could Soar 147% in 2016 appeared first on Profit Confidential.

Sunday, April 24, 2016

From Hero To Zero: What Should We Do With Brazil?

Published here: http://www.zerohedge.com/news/2016-04-24/hero-zero-what-should-we-do-brazil

Brazil Rousseff impeachment

Source: slate.com

In the past few weeks we have been discussing the different measures the central banks have been taking in an attempt to resolve the current issues. As China was expected to have a hard landing and as Brazil’s economic woes seem to be accelerating rather than improving, it’s not unlikely both countries will continue to dominate the scene of the world economy as they account for half of the BRIC countries.

The elephant in the room is obviously China. Nobody knows the real situation of the country’s economy and most definitely don’t believe the ‘official’ numbers the country is releasing, but let’s first take a minute to digest how Brazil is doing. After all, it is one of the BRIC countries and has a relatively sizeable economy that has been growing at a fast pace, until this growth rate was abruptly halted.

Brazil GDP Growth

Source: tradingeconomics.com

Whereas the country’s GDP grew by almost 3% in 2013, this improvement came to a screeching halt in 2015 as the GDP shrank by 3.8%, and the consensus estimates for the current financial year are indicating a similar contraction. Good, fine, two years of a 4% correction might not be a huge problem and could be a good way for the country to catch a breath and re-think its economy, but what’s even more dangerous is the inflation rate. Not only will the GDP shrink by approximately 4% this year, the CPI inflation rate will very likely increase to almost 10%.

But wait, that’s not it. Brazil was generally seen as a country with an acceptable risk/reward ratio as the government debt remained under control, but the recent huge budget deficits have quickly changed the situation. Whereas Brazil had a government debt/GDP ratio of less than 50% in 2012, it ended 2015 with a total debt ratio of almost 70%, increasing to 80% by the end of next year (according to estimates from ABN AMRO, a well-known European bank).

Brazil Unemployment rate

Source: ibidem

Combine that with an increasing unemployment rate (which doubled in 2015 from a little bit over 4% to almost 8% and a crashing consumer confidence, and you just know you’re in for some problems. In fact, the consumer confidence has now reached an ultra-low level we haven’t seen in over a decade. Even during the global financial crisis the consumer confidence level didn’t fall below 90, whilst it has now dropped to the mid-sixties on the back of the huge political scandals in the country.

Brazil consumer confidence

Source: ABN AMRO

Indeed, an impeachment procedure against president Rousseff has been started, but the problem isn’t necessarily limited to Rousseff herself. In fact, the loudest voice asking for her to be removed from office is coming from Cunha, who doesn’t really have the best name either. On top of that, the investigation is much more widespread than just having a look at Rousseff’s dealings in the Petrobras scandal. Several party members of Rousseff’s party as well as members of her alliance partner (the Partido de Movimento Democratico Brasileiro) are also being investigated, and the problem doesn’t seem to be able to be contained to just the people in power.

Brazil Bovespa 1

Source: stockcharts.com

Political insecurity can kill a country’s economy, and it is slowly and surely suffocating Brazil’s economic prospects. In fact, it’s still possible the Tribunal Superior Eleitoral might still annul and invalidate the results of the election of 2015 (yes, that has been two years ago!) which could push the country over a cliff. Invalidating the electoral results would have a devastating effect on the stability of the country as there’s no way to tell what the outcome of the new elections will be.

As the total size of the Brazilian economy is $2.2T, the world should pay more attention to this situation, as it once again indicates there is no real locomotive for the world economy anymore. Corporate profits in the USA are falling, China is having a tough time as well, the Middle East is seeing its purchasing power being crushed due to the low oil prices and now Brazil is facing a hopeless situation as well. The CDS premiums have increased exponentially, from 100 bps in 2013 to a high of in excess of 500 bps last year. The political problems are tightly connected to the country’s economy, but impeaching a president and appointing a new one most definitely will not be Brazil’s Saving Grace.

>>> Protect yourself and read our Guide to Gold TODAY!

Secular Investor offers a fresh look at investing. We analyze long lasting cycles, coupled with a collection of strategic investments and concrete tips for different types of assets. The methods and strategies are transformed into the Gold & Silver Report and the Commodity Report.

Follow us on Facebook @SecularInvestor [NEW] and Twitter @SecularInvest

Saturday, April 23, 2016

Continued Financial Market Deterioration Impacts Gold Eagle Sales In A Big Way

Published here: http://www.zerohedge.com/news/2016-04-23/continued-financial-market-deterioration-impacts-gold-eagle-sales-big-way

SRSrocco Report

By The SRSrocco Report

The financial system is sitting on the edge of a cliff and an increasing number of investors are beginning to realize it.  I hear more and more evidence from contacts in the financial and precious metal industry that the U.S. banking industry and Dollar are in serious trouble.

While some of individuals believe that the Fed and U.S. Government will continue rigging the markets for the next decade or more, I believe we will witness a financial dislocation or black swan event within the next year.

As I have stated in several interviews, I sold my business and left the big city and moved to the country back in the beginning of 2007.   I knew the mortgage industry and economy were going to collapse.  What I didn't know was the degree to which the Fed and Central banks could prop up the market.

NOTE:  If you haven't checked out our new PRECIOUS METALS INVESTING PAGE, please do.

It has been eight years now and the silver bullets have run out.  While the Fed and Central Banks will continue to rig the markets as best they can, the amount of debt overhanging the market has become unsustainable.  As Central banks push interest rates negative, it just motivates more investors to get into gold and silver.

Last week there were several emergency Fed meetings followed by China's launching of its new gold yuan benchmark this Tuesday.   Also, according to Global Research News:

China has reportedly decided ”there can be no conversion of gold-backed Yuan to or from US dollars.”  What China fears is that many countries around the world will want to trade their reserve US dollars  for the new Yuan, leaving China with mountains of worthless US dollars.  China already has several trillion in US dollar reserves and does not want or need more.

If the news reports that China will not allow a conversion of its new gold-backed Yuan to or from U.S. Dollars, this is indeed serious trouble for the United States Empire.  Which is the very reason I believe there were emergency Fed meetings last week.  Even though there hasn't been any major impact via the mainstream media, the ramifications are likely to become public in due time.
Gold Eagle Sales Surge 3 Times Higher In April

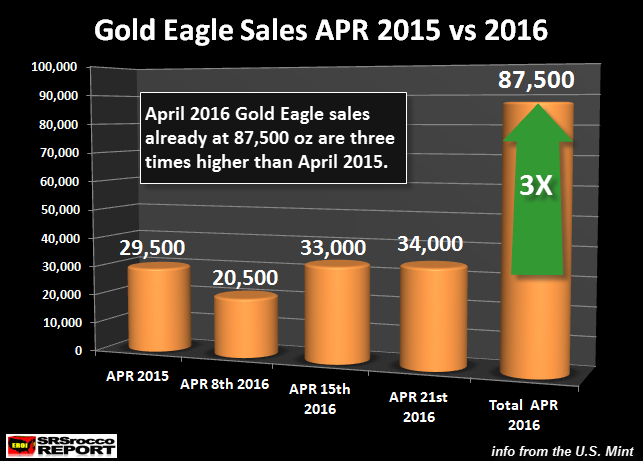
The telltale sign that something isn't right in the financial industry is a surge in Gold Eagle sales.  Last year, total Gold Eagle sales for April equaled 29,500 oz.  However, in just the first three weeks of April this year, Gold Eagle sales have reached 87,500.  This is three times last years figures and we still have another week remaining in the month:

Gold Eagle Sales APR 2015 vs 2016

We can see in the chart above, the weekly sales in the second (33,000 oz) and third week (34,000 oz) of April surpassed the total for the month last year.  Furthermore, April's sales so far of 87,500 oz are nearly two-and-a-half times the 38,000 oz sold last month.

Now, if we compare total Gold Eagle sales for 2016 versus the same period last year, we have the following result:

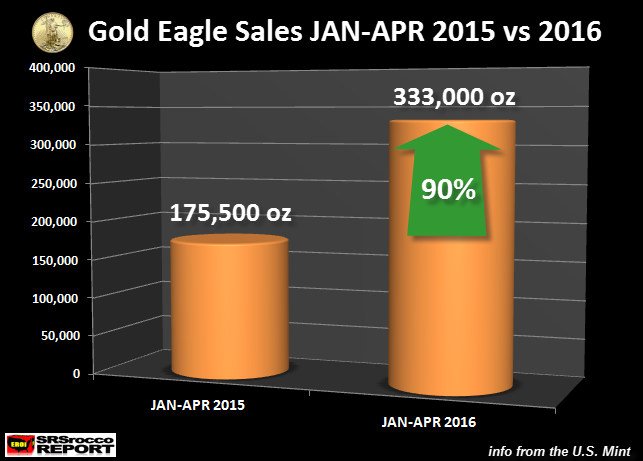
Gold Eagle sales JAN-APR 2015 vs 2016

The U.S. Mint's Gold Eagle (JAN-APR) sales are 90% higher at 333,000 oz compared to the same period last year of 175,500 oz.  If demand for Gold Eagles continues to remain strong for the remainder of the year, we could see total sales exceed 1 million oz.  This figure hasn't been seen since 2011 when total Gold Eagle sales reached 1 million oz.

Here are the following annual Gold Eagle Sales totals (troy oz):

2007 = 198,500

2008 = 865,500

2009 = 1,435,000

2010 = 1,220,500

2011 = 1,000,000

2012 = 753,000

2013 = 856,500

2014 =524,500

2015 = 801,500

2016 Ytd = 333,000

With the Chinese recent launch of their new gold-backed Yuan, the days of U.S. Dollar hegemony are numbered.  When the world starts dumping U.S. Treasuries and Dollars, investors better make sure they have already own physical gold and silver.

Please check back for new articles and updates at the SRSrocco Report

Silver Prices Are Setting Up for 900% Move in Silver?

Published here: http://www.profitconfidential.com/silver/silver-prices-are-setting-up-for-900-move-in-silver/

Three Reasons to Be Bullish on Silver Prices
It’s very simple: if you are in the market to double your money, then paying attention to silver prices could be a great idea.

You see, to assess where the gray precious metal could go, I look at three indicators: the gold-to-silver ratio, the correlation between silver and money supply, and the exploration-to-production ratio of silver mining companies. These three indicators are.

The post Silver Prices Are Setting Up for 900% Move in Silver? appeared first on Profit Confidential.