Monday, May 8, 2017

Gold Coins, Bars In Demand - +9% In Q1, 2017

Published here: http://www.zerohedge.com/news/2017-05-08/gold-coins-bars-demand-9-q1-2017

Gold Coins and Bars Demand Rises 9% In Q1, 2017

- Global gold demand in Q1 2017 was 1,034.5t
- Total demand -18% from record high levels in Q1, 2016
- Demand for coins and bars up 9% yoy to 290 t
- UK demand for coins, bars at highest since Q2 2013
- ETF inflows fell by 2/3, account for overall -18% fall in demand
- European uncertainty brings gold investors to market
- Innovation continues to drive gold demand in China
- Peak Gold: Mine production likely to drop
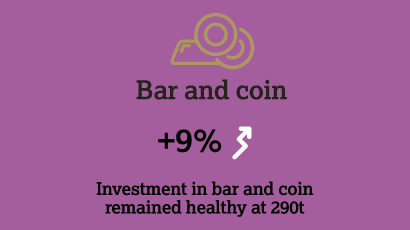
Global gold demand driven by climb in bar and coin investment

Uncertainty in Europe increased demand for gold investment products in the first quarter of the year, according to the World Gold Council's Gold Demand Trends Q1, 2017 report.

Across the globe a mixture of festivities and renewed safe haven buying saw demand for gold bars and coins climb by 9%.
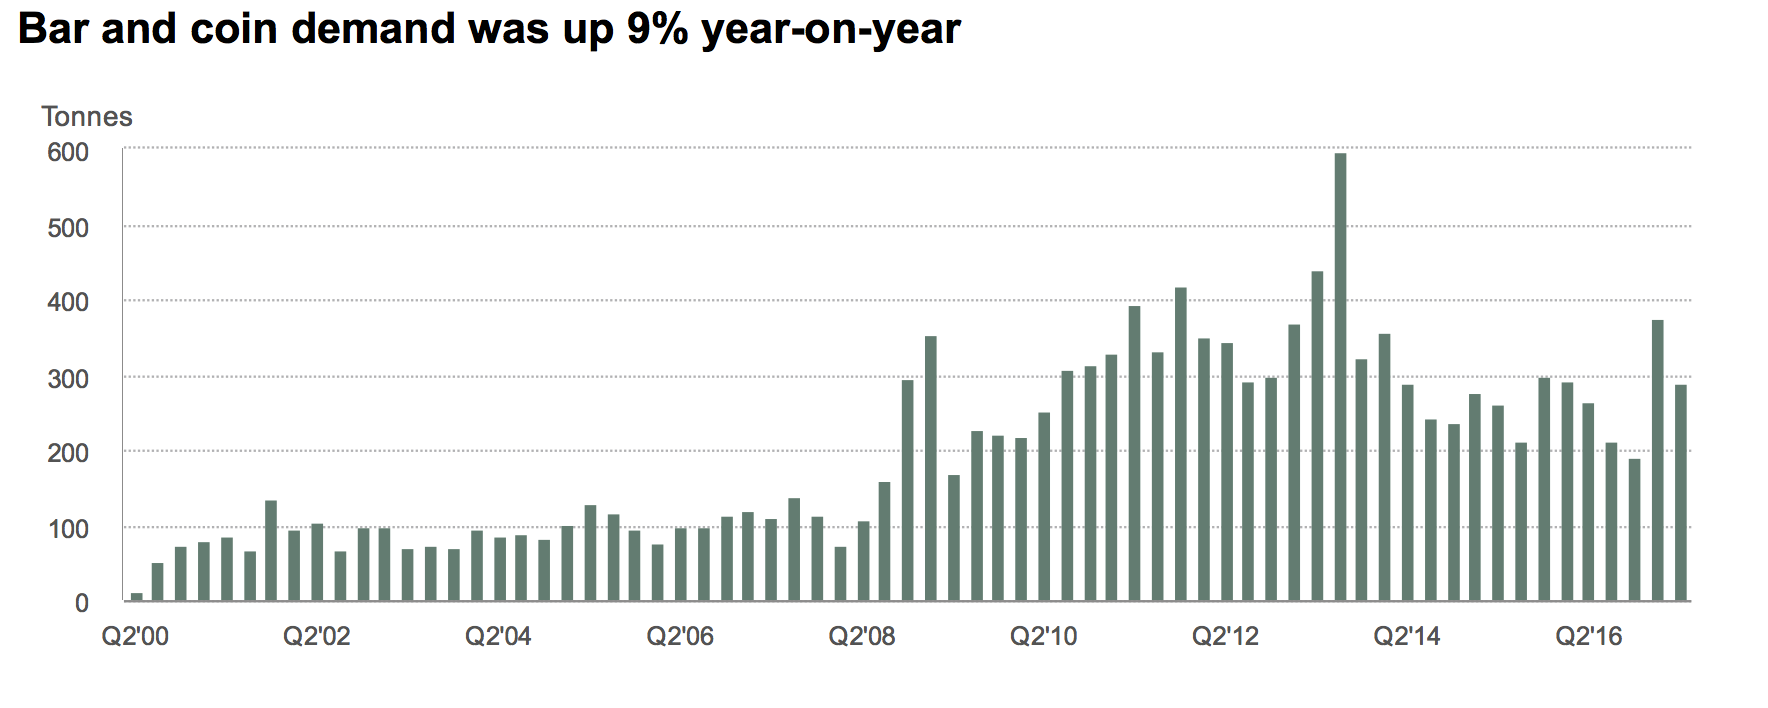
Demand for physical investment products helped to reduce the the overall fall in gold demand, which came in at 18% yoy, across investment, jewellery and central bank demand.

In all, global gold demand across a number of measures points towards a world that is uncertain and to ongoing safe haven demand. In some cases such as in the US, EU and China, demand remains robust whereas in the likes of Turkey demand is down from record levels.

Much of this is thanks to geo-political uncertainty and political upheaval.

Political uncertainty in Europe has helped to increase demand for gold bullion. Elections (upcoming and past) in the UK, Netherlands, France and Germany have helped to buoy investment in safe haven gold.  German gold bar and coin demand had its strongest first quarter since 2011 - 13% y­o­y to 34.3t, but this must not take away from the UK which hit its highest level since Q2 2013.

China (discussed in full below) was a major contributor to the uptick in demand for gold bars and coins, posting a 30% gain. As with its European counterparts, there is much uncertainty over the economic situation of the country and both investors and retailers alike are able to match these feelings with gold purchases.

Politics, uncertainty and gold prices make for a mixed bag of jewellery

When it comes to jewellery, demand was mixed across the board but overall very low, compared to recent years. Demand was 18% below the 587.7t five­ year quarterly average. The 9% climb in the USD gold price, meant that there is overall long-term weakness in the sector.

Whilst uncertainty can be a positive driver for gold demand, this combined with a high gold price in Turkey saw demand for jewellery sink to a four year low of 7.7t. The looming referendum (held in April) combined with the fact that the price of gold in lira rose more than in any other currency during Q1 (+12%), meant that the fragile political and economic conditions continued to impact the sector.

The WGC state that “The outlook for the [Turkish] market is weak” and this is expected to continue as both economic and political reforms keep both uncertainty and the gold price high.

In the United States however, a feeling of relief following the US election propelled jewellery demand to its strongest Q1 since 2010 -  it rose 3% to 22.9t. The WGC refers to a climb in ‘clicks and mortar’ (online) purchases. There is little doubt that the election hasn’t increased uncertainty, but it seems there is a calm before the storm element to purchasing decisions.

In Europe, both the UK and France let the side down when it came to jewellery demand, which fell 6% in the Fifth Republic. Much of the fall was down to uncertainty in the run-up to elections and a spate of terrorist attacks.

It seems many buyers are favouring ‘branded silver’ in their jewellery purchases. In the same way that silver coin and bar buyers see silver as better value than gold - it seems that jewellery buyers also may be attracted to getting better value with silver.

Investment is better than jewellery - even for romantics

On Valentine’s Day we discussed the problems with buying jewellery as an investment. Jewellery is a terrible investment due to the significant mark-up at the point of sale, 'valued added' (VAT) and sales taxes and it’s very poor resale value. We suggested that romantics buy gold coins and bars for their loved ones instead.

This advice was perhaps heeded even after Valentine’s Day as gold bars and coins had an excellent quarter, with 289.8t of demand (+9% y­o­y). Much of this was thanks to China, where safe haven flows, tech innovation and Chinese New Year is helping to push demand (see below).

The WGC accounts much of the increase in coin and bar demand to the ‘strength of the retail investment market’ internationally. Companies such as GoldCore are seeing very strong demand - particularly for allocated and segregated storage for risk averse investors looking to own in gold bars and coins.

The feeling of uncertainty  and uncertain outlook does appear to be driving demand and this is a trend we suspect we will continue to see. Whilst elections have been, or will soon be decided, that does not guarantee the economic result, investors are aware of this and stocking up on gold accordingly.

Gold ETFs failed to benefit as much as physical gold

Whilst ETF inflows did not experience the same surge as gold bar and coin demand, US demand was strong. As the WGC points out, geopolitical tensions were ‘more of a concern for European ­based investors than for their US counterparts.’

The report refers to the positivity in the US towards gold, and that the speculative buying seen in 2016 has been ‘reversed in the November/December washout’ leaving strategic investors behind. Having said that the only net inflows were in February, ‘sandwiched between’ outflows in January and March.

Collectively in Europe we make for a worried bunch. Europeans increased inflows in gold ETFs, as we saw with gold bar and coin demand.

As summarised by the WGC, we are surrounded by both economic and political uncertainty which, with some dips in the gold price, meant we could increase our exposure to gold:

‘On top of a fragile political environment, conditions in financial markets gave investors a further incentive to build their positions in gold-­backed ETFs. Safe­ haven flows pushed two­ year German yields further into negative territory, reaching a record low of ­0.95% in February. And European equity markets were subdued with volatility at multi­year lows. Negative real and nominal yields coupled with a period of relative calm in regional stock markets improved the appeal of gold, particularly as its price strengthened through the quarter. The dips in the euro­ denominated price of gold in January and March were also taken as a good opportunity to add it to portfolios.’

Gold ETF holdings grew tremendously in 2016. 2017 has failed to keep up as of yet. Inflows were just one-third of those seen in Q1 2016. Unsurprisingly the WGC do not seem unduly worried, despite pointing towards the fact that Q1’s figures might be pointing to a wider financial issue, ‘inflows of 109.1t are in line with quarterly average between Q1 2009 and Q4 2011 (108.7t), a period that encompassed the global financial crisis.’

Whilst calm is often seen settling across a market after a surge such as that seen in 2017, we wonder if we will continue to see a slow-down in ETF inflows, especially if averages such as these have not been since since the financial crisis.

Earlier this week we wrote about the tenuous London property market and asked if this was an indicator of a bubble about to burst, setting off a domino affect around the world. This would obviously lead to even greater safe haven flows and demand.

Innovation holds key to future of China’s gold market

Whilst the gold market is one of the oldest in the world, it is markedly different from how it once began.

Gold bullion dealers and jewellery sellers have made a concerted effort to keep up with innovations across the technological, investment and retail spaces. This is more important today than it has ever been.

In China, there has long been concern that China’s millennial population will not look at gold in the same way as their elders do. The WGC cites research from Agility Research & Strategy which shows the top three priorities for young Chinese are ‘health, travel and spending time with the family’. This, combined with concerns over the economy, has prompted worries for the future of the world’s largest gold market.

However, innovation both technological and in marketing suggests that the Chinese gold market has a resilient and fruitful future. As the WGC writes, “the industry is keen and determined to adapt – an attitude that should help stem any weakness.”

In the jewellery space, where demand was slightly down by 2% thanks to high gold prices following Chinese New Year, sellers are providing services and products to keep up with today’s younger generations - such as more modern 18k gold jewellery pieces, rather than the traditional 22k gold designs. In a perhaps more reflective sign of the times, sellers of bridal jewellery are ‘offering customers a no­-cost exchange option on jewellery from its bridal range.’

Jewellery demand may have experienced a small decline, but gold bars and coins saw a 30% increase (yoy), its fourth best quarter on record. We would generally expect the first quarter of the year to be a strong one for China, given their New Year, however it was this combined with concerns regarding the economy (falling yuan and property market) that drove demand to 105.9t.

Some of this stellar demand can be attributed to the innovation appearing in the local gold market, namely interest-paying gold accounts, benchmarked on the Shanghai Gold Exchange (SGE)’s AU9999 contract with a minimum entry point of one gram. It is traded online, with an option for physical delivery - all important for Chinese investors.

Online developments continue with 800 million WeChat users being given access to MicroGold, a physical gold-backed product offered by ICBC. Digital gold can be traded between individuals, online, supporting festivals and culturally significant events with ‘red envelopes.’

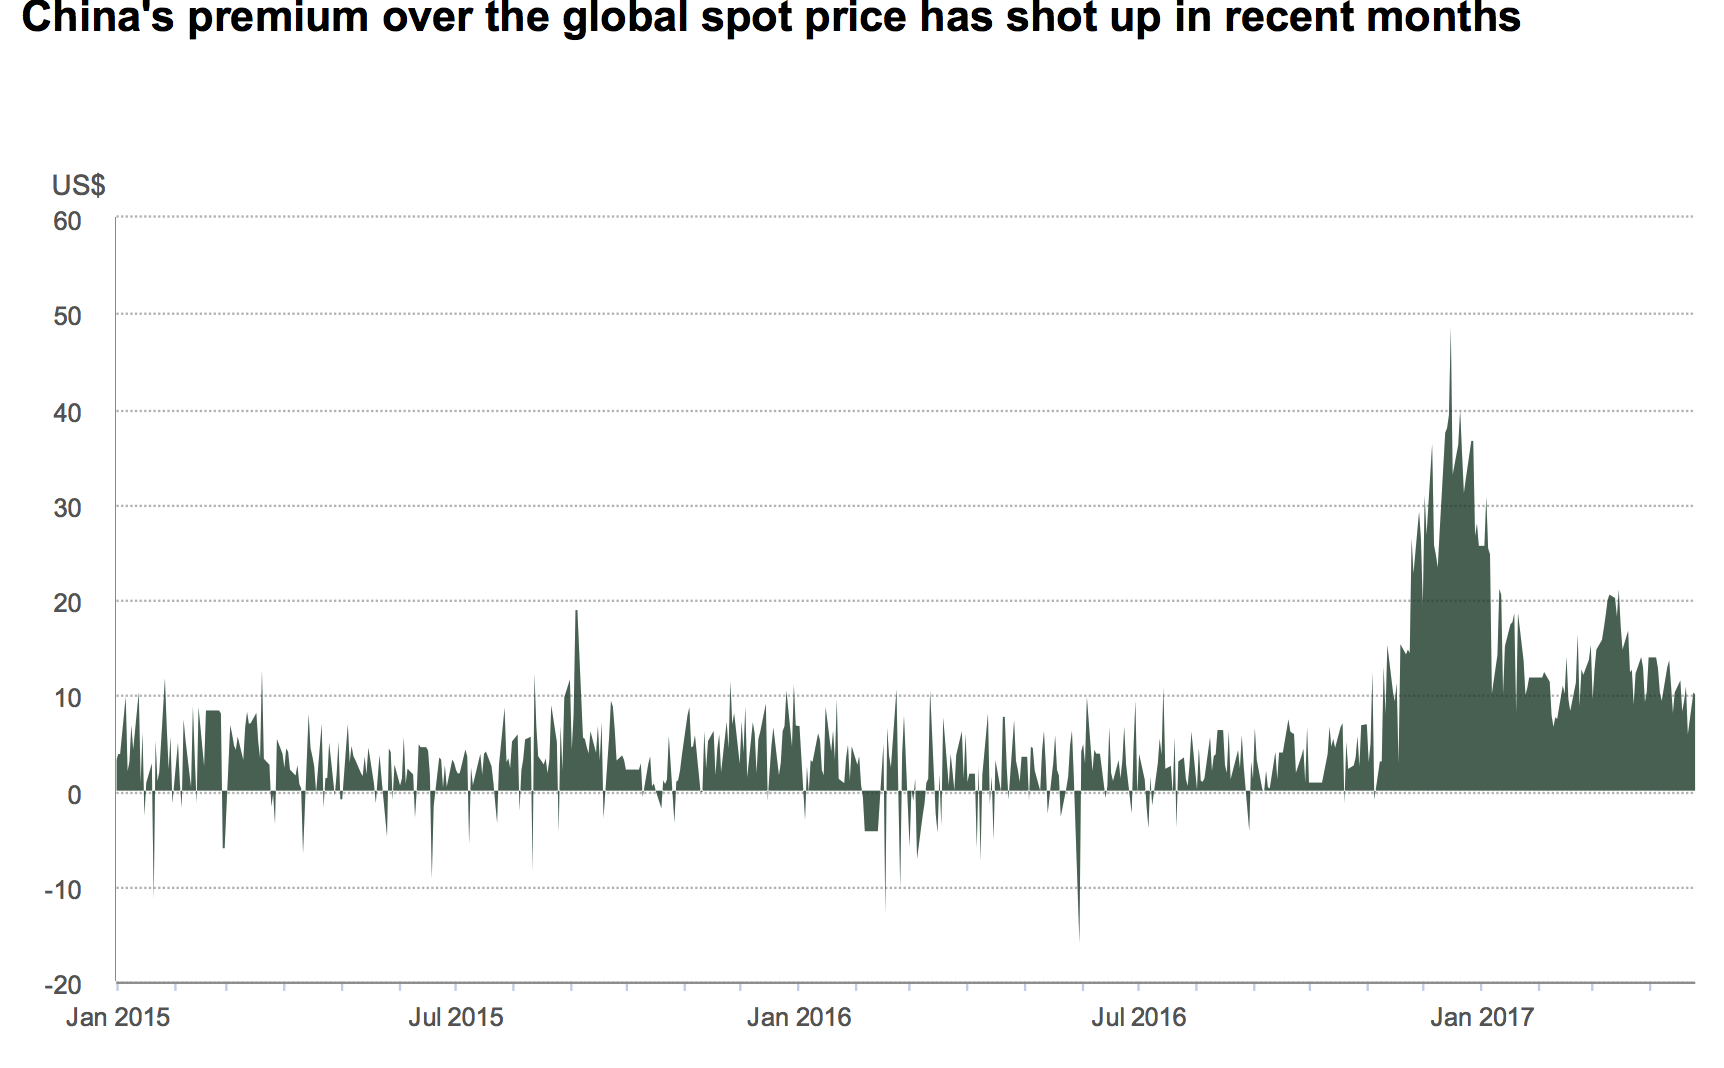
These moves, combined with recent changes supported by the government have lead to an imbalance between supply and demand. Premiums have shot up over global gold price in recent month, they averaged $17/oz in Q4, 2016, and averaged down to US$14.2/oz.
India, cashless push was merely a setback but innovation required

India had a tumultuous year last year, the second-half of 2016 saw Modi take the country by surprise when he announced the removal of old Rs 500 and Rs 1,000, throwing millions of people into financial chaos. The announcement was particularly badly timed due to wedding season which is vital to the country’s gold industry.

Since then gold demand has managed to find some calm. Whilst global jewellery demand remains weak with just a 1% increase in Q1 India has propped it up, despite rising gold prices, posting a 16% gain.

The 16% gain isn’t really much to shout about, given it is only the third quarter this decade where demand has come in at less than 100t (92.3t). There is still some wariness in terms of how the next phase of remonetisation will play out, combined with uncertainty over the forthcoming Goods & Service Tax (GST), which is dampening demand somewhat.

We would suggest that there is something to be learnt both at the business and political level when it comes to innovation in the gold market. This is perhaps coming to pass as the WGC’s field research found that not only are consumers gradually adopting cashless payments, but cashless transactions are ‘gathering momentum’. Retailers such as Tanishq reported a ‘quite significant recovery’ in Q1, on account of cashless transactions.

At this point we should issue a word of warning, as we did when India announced its move to cashless and the topic became the point of discussion in economic circles. Whilst cashless is publicised as a way to make economies more efficient, to reduce tax evasion and to prevent other criminal activities it is also there to serve an ulterior motive - as we wrote a few month’s ago:

“A cashless world means a transparent world, which is great if terrorists were the only ones using cash. But they’re really not, so a cashless world means transparent bank accounts which means restricted banks accounts.”

This is perhaps yet another reason why gold demand is recovering in India.

Trivial sales in Central Bank demand

Whilst purchases buy central banks slowed, they remained robust - especially from Russia and China - and central bank sales remain nearly non existent and are set to do so.
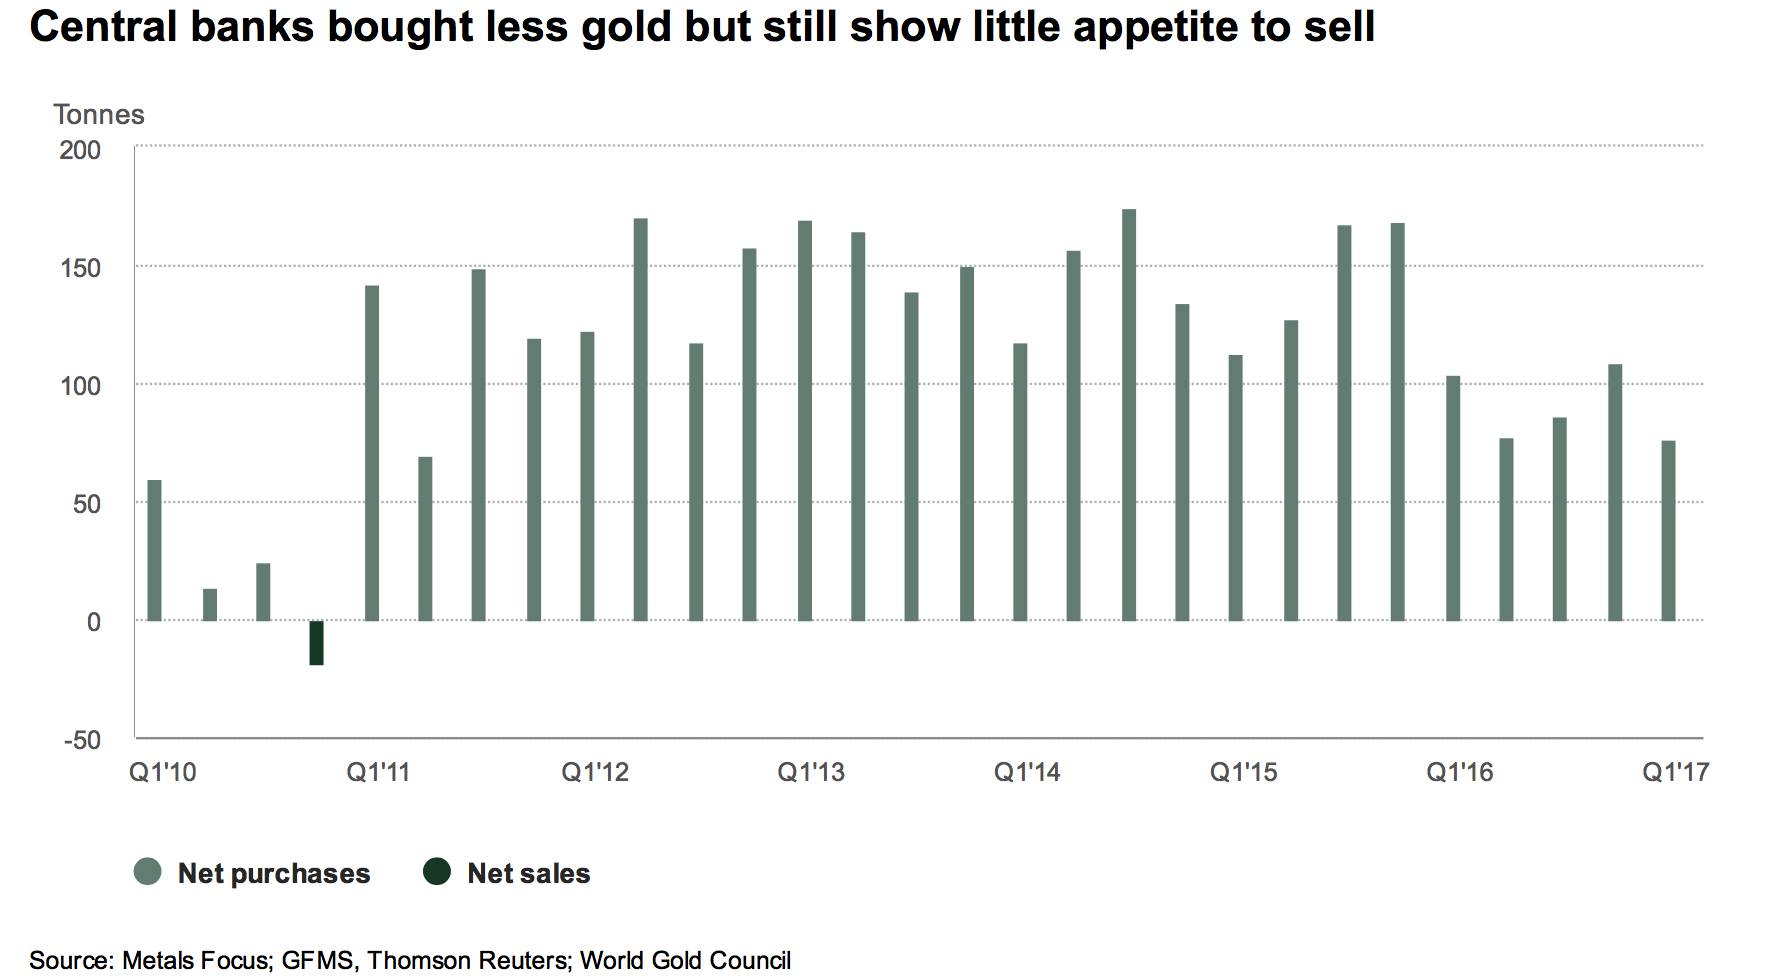
Quarterly net purchases were 76.3t (a six year low) and a 27% fall yoy. Russia and Kazakhstan were the main buyers in the quarter.

China’s gold reserves still represent just 2% of their total reserves, despite not adding to the reserves since October 2016. The ratio hit 2.4% in Q1, its highest point since the early 2000s and the reason perhaps for no further purchases since 2016. It is also worth noting the pressure their FX reserves have felt for some time having dropped from US$3.2 trillion in January 2016 to US$3 trillion in January 2017.

Peak Gold: Mine production likely to drop

There are many tidbits of information in the WGC’s report about overall mine production in Q1 2017.

Indonesia accounted for the largest impact on the fall in production, thanks to a fall on 8t from its Grasberg region. There were also some areas of growth, however physical gold investors mainly need to be aware of the following summary from the WGC:
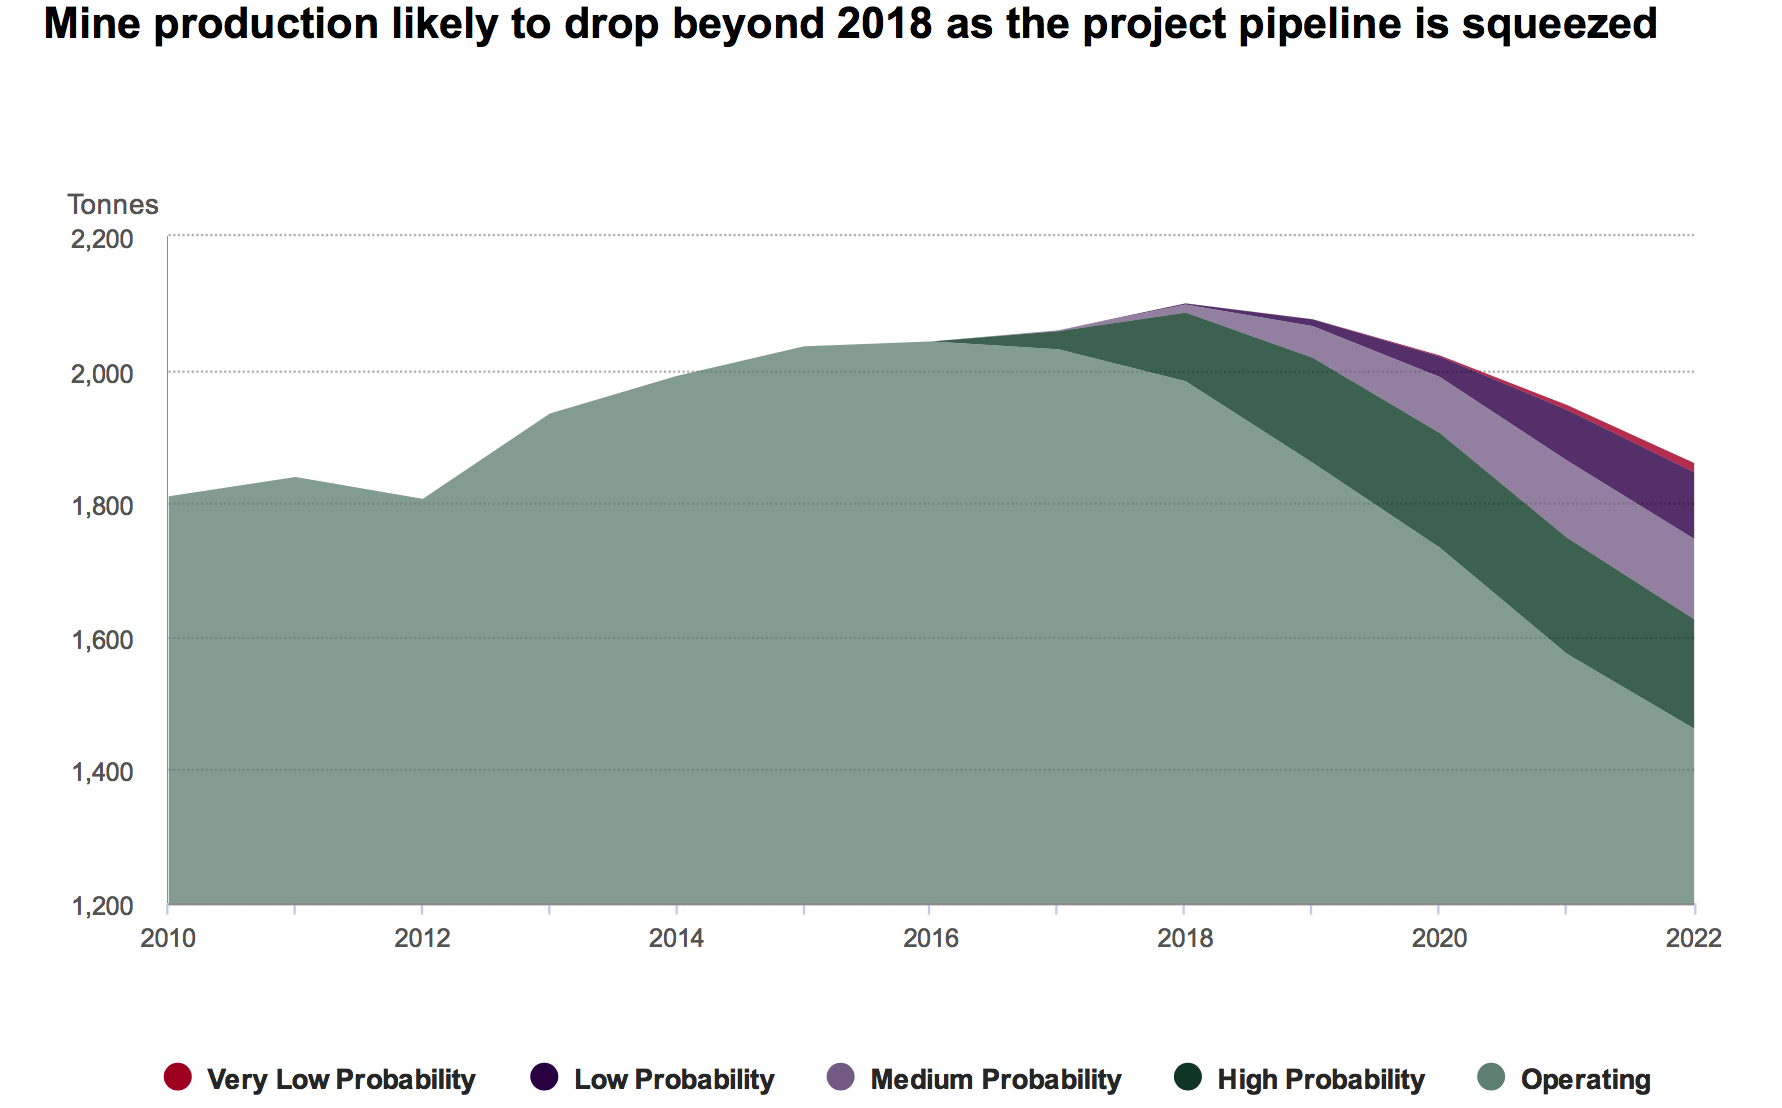

“Having plateaued in recent years, mine production will soon enter a period of decline. The production profile of currently operating mines shows a relatively steep drop-­off over the next 5 to 10 years. Even factoring in high­ probability projects (those highly likely to reach commercial production), the fall in production is still significant.”

The negative feeling from the WGC is attributed to cuts in capital expenditure but most importantly the fact that there just aren’t that many new discoveries of gold.

“Inevitably, the supply pipeline will be squeezed…The speed at which production will fall is uncertain. As existing reserves are depleted, the current project pipeline will be unable to replace them fully.

Over the long­term, the global production profile will depend on the trajectory of the gold price and potential exploration upside, particularly the speed with which brownfield exploration can be brought into production”

Conclusion: Buy physical gold - not making much more of it

The news that gold production is falling and the near certainty that production levels will fall in the coming months and years should be enough to encourage investors to buy gold.

Even if political and economic turmoil weren’t a factor in every major country, gold demand would still be pertinent thanks to the issue of peak gold.

However, it is the imminent feeling of uncertainty and growing instability which is driving investors to allocate more of their investment and pension portfolios to gold bars, coins and ETFs.

The motto ‘Stay calm and carry on’ is no longer relevant, it should be ‘stay calm and buy gold’.

News and Commentary

Gold up on buying, euro strength after Macron’s win in France (Reuters.com)

Euro Edges Higher as Macron Beats Le Pen in French Election (Bloomberg.com)

Lower gold prices bolster gold demand; premiums rise in India, China (Reuters.com)

Chinese demand for gold bars and coins soars in first quarter (People.cn)

Hong Kong exchange operator hopes for third time lucky when it comes to gold futures (SCMP.com)

China gold reserves unchanged at end-April (Reuters.com)

Gold Demand Trends Q1 2017 (Gold.org)

Gold-Futures Shorting Attacks (321Gold.com)

Jaw-Dropping 4,700 Tonnes Of Paper Silver Sold In Just 2 Hours (KingWorldNews.com)

Attacks on gold don't come from mere 'speculators' (Gata.org)

Greatest Ponzi Scheme in History (DailyReckoning.com)

7RealRisksBlogBanner
Avoid Digital & ETF Gold – Key Gold Storage Must Haves

Gold Prices (LBMA AM)

08 May: USD 1,229.70, GBP 948.71 & EUR 1,123.45 per ounce
05 May: USD 1,239.40, GBP 958.06 & EUR 1,130.33 per ounce
04 May: USD 1,235.85, GBP 958.15 & EUR 1,131.05 per ounce
03 May: USD 1,253.95, GBP 971.18 & EUR 1,148.99 per ounce
02 May: USD 1,255.80, GBP 974.25 & EUR 1,150.19 per ounce
28 Apr: USD 1,265.55, GBP 978.40 & EUR 1,156.84 per ounce
27 Apr: USD 1,264.30, GBP 980.21 & EUR 1,160.63 per ounce

Silver Prices (LBMA)

08 May: USD 16.38, GBP 12.64 & EUR 14.96 per ounce
05 May: USD 16.27, GBP 12.58 & EUR 14.85 per ounce
04 May: USD 16.50, GBP 12.80 & EUR 15.09 per ounce
03 May: USD 16.85, GBP 13.04 & EUR 15.44 per ounce
02 May: USD 16.95, GBP 13.12 & EUR 15.53 per ounce
28 Apr: USD 17.41, GBP 13.45 & EUR 15.92 per ounce
27 Apr: USD 17.46, GBP 13.53 & EUR 16.02 per ounce


Recent Market Updates

- Irish Property Bubble – 38pc Believe Housing Market Will Crash
- Silver Bullion On Sale After 10.6% Fall In Two Weeks
- London Property Bubble Vulnerable To Crash
- Silver price manipulation, is regulation putting a stop to it?
- Trump 100, Margin Debt Stock Bubble and Gold
- Gold Bullion Imports Into China via Hong Kong More Than Doubles in March
- LePen Euro Frexit Panic Over – “For Now”
- Gold Sovereigns – ‘Treasure’ Trove Found In UK – Don’t Be The Piano Owner
- Silver, Platinum and Palladium as Investments – Research Shows Diversification Benefits
- When Trump Turns On “Enemy Within” Fed It May Create 1970s Style Stagflation
- Silver Production Has “Huge Decline” In 2nd Largest Producer Peru
- Gold Erases Post- Election Fall as Trump Wrong on Dollar
- Perth Mint Silver Bullion Sales Rise 43% In March
Access Award Winning Daily and Weekly Updates Here

Silver Elevator Keeps Falling, Report 7 May, 2017

Published here: http://www.zerohedge.com/news/2017-05-08/silver-elevator-keeps-falling-report-7-may-2017

The dollar moved strongly, now over 25mg gold and 1.9g silver. This was a holiday-shortened week, due to the Early May bank holiday in the UK.

The big news as we write this, Macron beat Le Pen in the French election. We suppose this means markets can continue to do what they wanted to do before the threat of Frexit, shutting off trade between France and the rest of Europe, and who knows what else Le Pen was plotting to do to the French people.

This will be a short Report this week, as Keith has been working hard on a paper to address the question of which metal will have the higher interest rate. Look for that tomorrow.

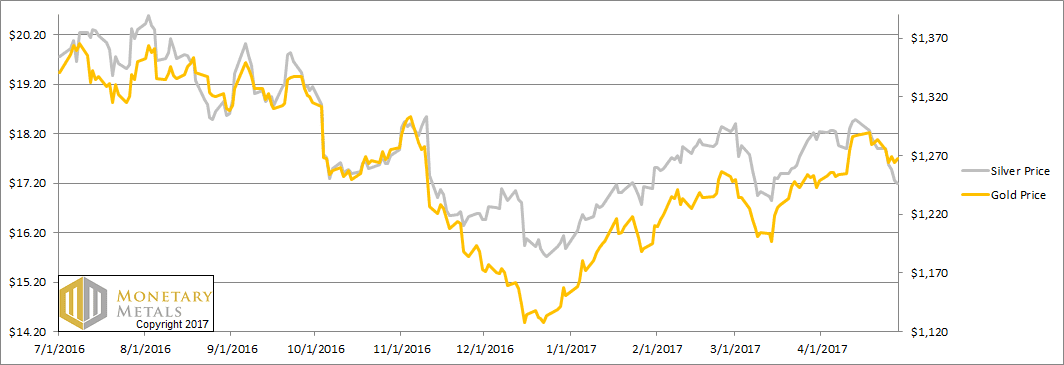
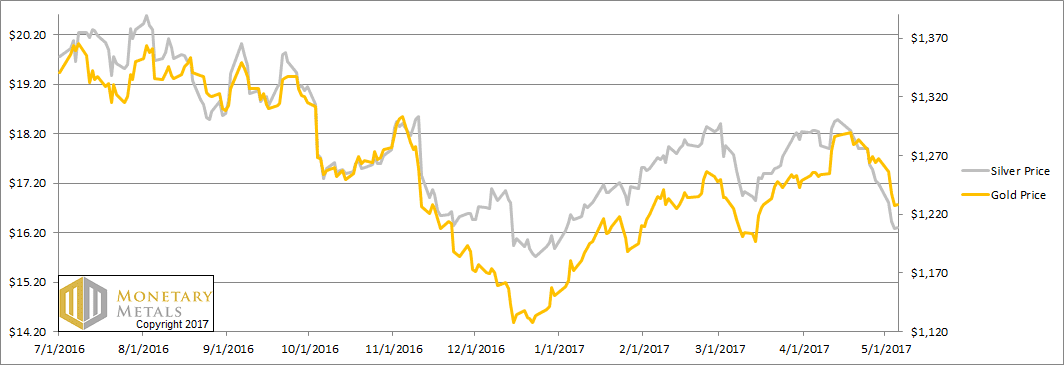
Below as the only true look at the supply and demand fundamental of the metals, but first, the price and ratio charts.

The Prices of Gold and Silver

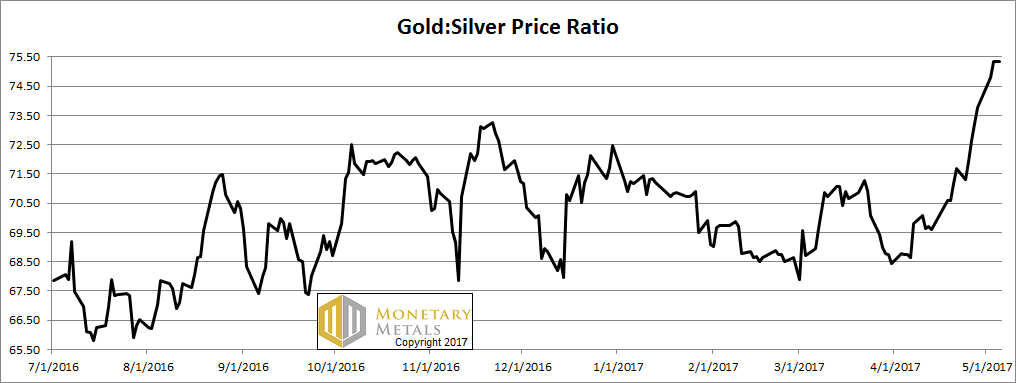
Next, this is a graph of the gold price measured in silver, otherwise known as the gold to silver ratio. It had another major move up this week, after a major move up last week and one the week before.

It now sits at the same level it was a year ago. If it breaks above 76, then the next resistance looks to be 80.

The Ratio of the Gold Price to the Silver Price

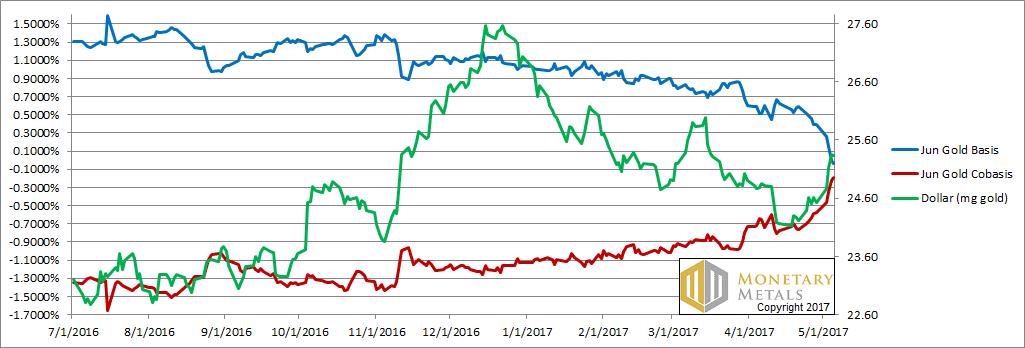
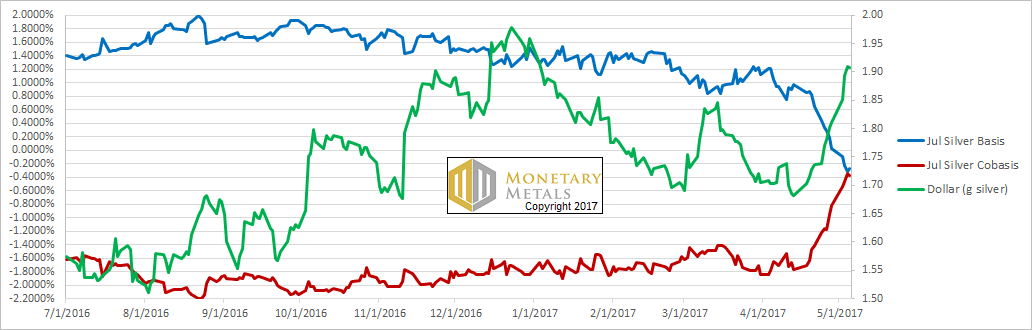
For each metal, we will look at a graph of the basis and cobasis overlaid with the price of the dollar in terms of the respective metal. It will make it easier to provide brief commentary. The dollar will be represented in green, the basis in blue and cobasis in red.

Here is the gold graph.

The Gold Basis and Cobasis and the Dollar Price

If we didn’t know better, we would say that as fast as the cobasis (i.e. scarcity, the red line) ran up, the price of the dollar (which is the inverse of the conventional view of the price of gold) ran up faster.

Actually, that is accurate. And consequently, our calculated fundamental price of gold fell over twenty bucks (though it’s still more than twenty bucks over the market price).

Now let’s look at silver.

The Silver Basis and Cobasis and the Dollar Price

In silver, the same phenomenon occurred though with exaggerated degree.

Last week and the week before, we asked:

Some speculators definitely got flushed. However, the question is how many and how much?

Then we said:

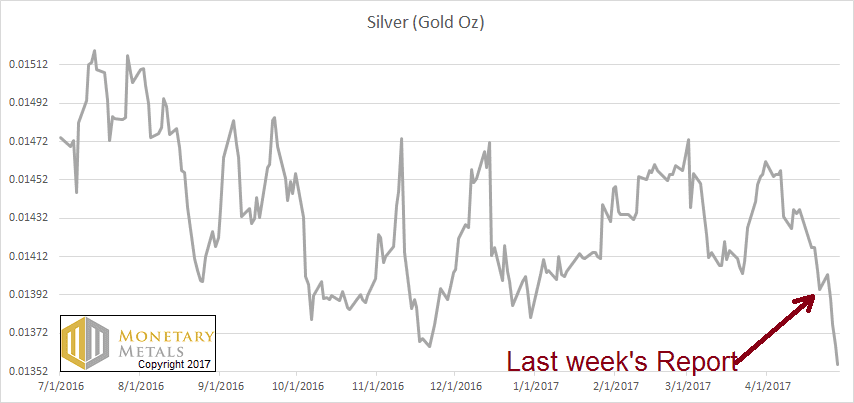
Clearly it happened to more of them this week. And, unless the fundamentals get stronger, it is likely to flush even more leveraged futures positions. Our calculated fundamental price fell three cents this week, now a buck thirty under the market.

It happened to more of them this week. That’s what a rising cobasis with falling price of silver means. A selloff of futures. A flush of the leveraged speculators.

Unfortunately for them, owners of metal were also selling. Our calculated fundamental price of silver fell almost penny for penny with the market price. It remains about a buck twenty under the market.

We saw a technical analysis trader write a note this weekend. He said he plans to short silver on Monday. When the technicals and then fundamentals align, that can make for an interesting week.

Keith will be speaking at the Metal Writers Conference in Vancouver, at the end of the month.

© 2017 Monetary Metals

Friday, May 5, 2017

Peak Gold, Silver On Small Finite Planet With Near Infinite Currency

Published here: http://www.zerohedge.com/news/2017-05-05/peak-gold-silver-small-finite-planet-near-infinite-currency

Peak Gold and Silver On "Small Finite Planet" With Near Infinite Currency

Peak gold and silver and the case for peak precious metals on "our small, finite planet" was the topic for discussion on the latest episode of the the Keiser Report.


(Max Keiser interview of Mark O’Byrne of GoldCore in 2nd half of show at 13 min 15 seconds)

Topics covered in the interview

- Small planet with finite resources including gold, silver
- Resources finite but near infinite creation of currency
- Derivatives and fiat currency creation going exponential
- Primary gold production fell in 2016 - Thomson Reuters
Peak gold - "biggest gold story not reported"
- Harder to pinpoint peak silver as is mining byproduct
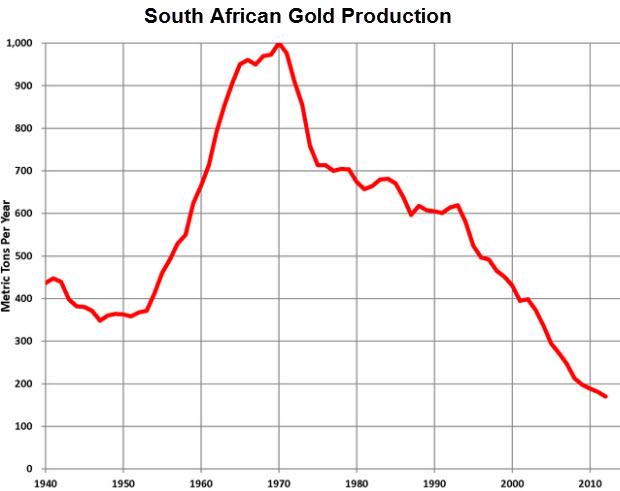
- South African gold production is 'canary in gold mine'
- SA gold production collapsed over 80% - from over 1,000 metric tonnes in 1970 to just 167.1 metric tonnes in 2016

- Price manipulation suppressing precious metals
- Supply demand deficits should result in "much higher prices" in the medium and long term
- Investors beginning to "see through the artificial nature of the sell offs" and accumulating on dips

Max and Stacy discuss the all talk, no action of young people and the ‘we’re going to rise up one day generation’ in the first half of the show. Central banks have become all talk, all action with their monetary revolution and currency debasement on a scale that the world has never seen before. They also look at how the UK enslaved itself in massive debt and is now a wholly owned subsidiary of the City of London.

Watch Interview Here


Related Content

Peak Gold – Biggest Gold Story Not Being Reported

‘Peak Gold’ – Gold Production Collapse Continues In South Africa

Peak Gold – Did Gold Production Peak in 2015?


Gold and Silver Bullion - News and Commentary

Gold edges up, but set for worst week since Nov (Reuters.com)

Metals Extend Sell-Off on Mounting China Concerns, Fed Outlook (Bloomberg.com)

Oil Tumbles Again, Asian Equities Fall Before Jobs (Bloomberg.com)

Gold Miners See Super-Sized Stock Moves on Earning Surprises (Bloomberg.com)

Iran's Gold Jewelry Demand Rises to 4-Year High, Bucks Oil Slump (Bloomberg.com)

Source: Themacrotourist.com via Bloomberg

Fed To Send Gold Higher Later In Summer - Rickards (Bloomberg.com)

Fed Raises Into Weakness, Sends Gold Higher - Rickards (DailyReckoning.com)

Own physical gold and silver to protect from futures manipulation (TFMetalsReport.com)

Hardest Trades Are Often Right: Time To Buy Silver? (ZeroHedge.com)

Why are US stocks so expensive, and how long can it last? (MoneyWeek.com)

Gold Prices (LBMA AM)

05 May: USD 1,239.40, GBP 958.06 & EUR 1,130.33 per ounce
04 May: USD 1,235.85, GBP 958.15 & EUR 1,131.05 per ounce
03 May: USD 1,253.95, GBP 971.18 & EUR 1,148.99 per ounce
02 May: USD 1,255.80, GBP 974.25 & EUR 1,150.19 per ounce
28 Apr: USD 1,265.55, GBP 978.40 & EUR 1,156.84 per ounce
27 Apr: USD 1,264.30, GBP 980.21 & EUR 1,160.63 per ounce
26 Apr: USD 1,264.95, GBP 986.79 & EUR 1,160.21 per ounce

Silver Prices (LBMA)

05 May: USD 16.27, GBP 12.58 & EUR 14.85 per ounce
04 May: USD 16.50, GBP 12.80 & EUR 15.09 per ounce
03 May: USD 16.85, GBP 13.04 & EUR 15.44 per ounce
02 May: USD 16.95, GBP 13.12 & EUR 15.53 per ounce
28 Apr: USD 17.41, GBP 13.45 & EUR 15.92 per ounce
27 Apr: USD 17.46, GBP 13.53 & EUR 16.02 per ounce
26 Apr: USD 17.59, GBP 13.72 & EUR 16.15 per ounce


7RealRisksBlogBannerAvoid Digital & ETF Gold – Key Gold Storage Must Haves


Recent Market Updates

- Irish Property Bubble – 38pc Believe Housing Market Will Crash
- Silver Bullion On Sale After 10.6% Fall In Two Weeks
- London Property Bubble Vulnerable To Crash
- Silver price manipulation, is regulation putting a stop to it?
- Trump 100, Margin Debt Stock Bubble and Gold
- Gold Bullion Imports Into China via Hong Kong More Than Doubles in March
- LePen Euro Frexit Panic Over – “For Now”
- Gold Sovereigns – ‘Treasure’ Trove Found In UK – Don’t Be The Piano Owner
- Silver, Platinum and Palladium as Investments – Research Shows Diversification Benefits
- When Trump Turns On “Enemy Within” Fed It May Create 1970s Style Stagflation
- Silver Production Has “Huge Decline” In 2nd Largest Producer Peru
- Gold Erases Post- Election Fall as Trump Wrong on Dollar
- Perth Mint Silver Bullion Sales Rise 43% In March
Access Award Winning Daily and Weekly Updates Here

Thursday, May 4, 2017

Gold & Silver; Slipping risk in play at these levels!

Published here: http://www.zerohedge.com/news/2017-05-04/gold-silver-slipping-risk-play-these-levels

Below looks at Gold Futures over the the past 8-years, reflecting that Gold remains in a clean bear channel (A) since 2011. Gold made another attempt to break free of this falling channel three weeks ago, only to be turned away again, disappointing Gold bulls again.

Today, Gold faces a “slipping risk” price point in the chart below at (3).

gold weekly kimble charting solutions

CLICK ON CHART TO ENLARGE

Three weeks ago, Gold attempted to breakout from falling channel (A) at (2). Results, Gold created a bearish reversal wick, at dual resistance. Since then, sellers have come forward, pushing Gold lower. This morning, Gold is testing bearish rising wedge support at (3). Slipping risk in play!

Gold isn’t the only metals asset that finds itself facing a “slipping risk!


gold and silver weekly kimble charting solutions

CLICK ON CHART TO ENLARGE

Silver also remains in a bear market since 2011 highs, creating a series of lower highs, similar to Gold. Silver in the right chart above is facing rising support, that if broken to the downside, would increase selling pressure.

Below looks at the Silver/Gold ratio that we share weekly with Premium and Metals Members. This ratio has been sending a long-term bearish message to this space for years.


slv gld ratio kimble charting solutions

CLICK ON CHART TO ENLARGE

To be long and strong owners of Gold & Silver, one wants/needs to see the Silver/Gold ratio to be heading higher. This ratio has remained inside of falling channel (A) in the left chart above since 2011. 6-year falling resistance was hit at (2) five weeks ago, where it reversed course and then proceed to break 9-month rising support. Further weakness then followed at (3). The Power of the Pattern has been sharing with our members since 2011, to treat all rallies as counter trend rallies until falling channel (A) can be taken out to the upside.

If you are interested in short, intermediate and long-term Power of the Pattern signals on this space, we would be honored if you were a Premium or Metals Member.


Send me an email to review a complimentary copy of our most recent Weekly Metals Research that provides weekly pattern analysis and actionable ideas on Gold, Silver, Copper and the Miners


Website: KIMBLECHARTINGSOLUTIONS.COM

Blog:  KIMBLECHARTINGSOLUTIONS.COM/BLOG


Questions: Email services@kimblechartingsolutions.com or call us toll free 877-721-7217 international 714-941-9381

Irish Property Bubble - 38pc Believe Property Will Crash

Published here: http://www.zerohedge.com/news/2017-05-04/irish-property-bubble-38pc-believe-property-will-crash

Irish Property Bubble? Central Bank Governor Denies Is Bubble

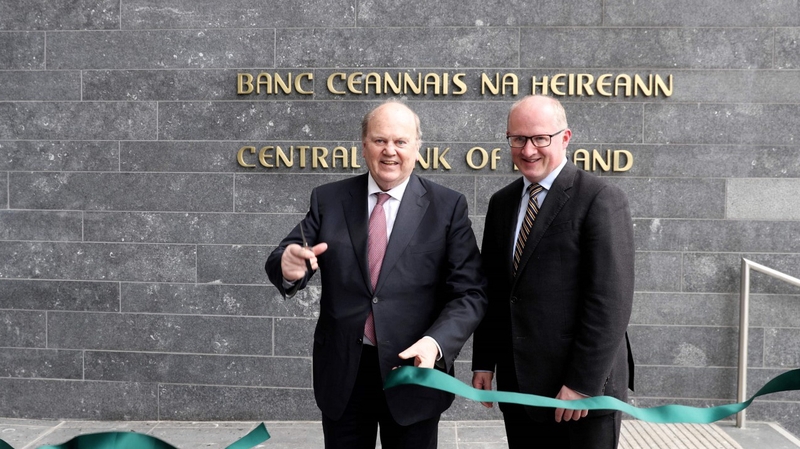
Central Bank of Ireland governor Philip Lane yesterday rejected suggestions of an Irish property bubble and that the economy is on the brink of another housing bubble and said the recent increase in house prices is not indicative of a property bubble forming.

Minister for Finance Noonan & Governor of the Central Bank Lane. Source: RTE

However, this optimism is not shared by a large part of the Irish people as there are very high levels of concern about the risk of another property bubble and property crash according to the latest Sunday Independent/Kantar Millward Brown poll:

"A quite astonishing 38pc of people believe that the housing market is destined to collapse as it did during the last recession. That is a much larger share than those who believe the contrary.

Growing fears about another property crash are reflected in another question put by the pollsters - "Is this a good time to buy a house?"

Five years ago, when the recovery hadn't got going and property prices were on the floor, an overwhelming majority thought it a good time to buy. Now less than half do.

The fear of history repeating itself with another crash in house prices could well explain why, despite high and rising levels of optimism, spending in the shops is not rising at the same pace."

The risks of a new Irish property bubble and another housing bubble comes at a time of considerable economic uncertainty due to the increasing likelihood of a 'Hard Brexit.' There are also the considerable risks from continuing uncertainty due to the Trump Presidency and contagion in the Eurozone.

Separately, news today comes that Irish executives increasingly expect a 'Hard Brexit' and are preparing accordingly.

The news comes on the same day that one of the largest retailers of food and meat in the UK, the Co-op, has announced it will sell only British beef and meat.

It publicly called on other UK retailers to "back home-grown goods" from the UK. Sainsbury and Tescos are major sellers of Irish beef and any knock-on change of policy would be hugely damaging to Irish farmers and the wider Irish economy.

The Dublin housing market is showing real signs of over heating and becoming a bubble again - particularly at the middle to higher end of the market.

Real diversification and an allocation to physical gold will protect from another new Irish property bubble and property crash.

Sources

Property crash in Ireland - 38pc believe housing market will collapse

No housing bubble - Central Bank of Ireland (RTE)

Central Bank governor rejects suggestions of new property bubble (Irish Times)

Brexit blockade: UK giant wants ban on Irish meat (Irish Independent)

Irish executives expect a hard Brexit  (Irish Times)

‘I hate people talking down the property bubble’ - Ross O'Carroll Kelly

Related Content

Property Bubble In Dublin Housing Market Developing

Property Bubble In Ireland Developing Again

London Property Bubble Vulnerable To Crash


Gold and Silver Bullion - News and Commentary

Gold logs lowest finish in a month (MarketWatch.com)

No housing bubble - Central Bank of Ireland (RTE.ie)

Central Bank governor rejects suggestions of new property bubble (IrishTimes.com)

Brexit blockade: UK giant wants ban on Irish meat (Independent.ie)

Irish executives expect a hard Brexit (IrishTimes.com)

source: Irish times

Property crash in Ireland - 38pc believe housing market will collapse (Independent.ie)

‘I hate people talking down the property bubble’ - ROCK (IrishTimes.com)

Le Pen victory could cause violent market reaction: Expert (CNBC.com)

Why now may be a good time to buy gold and silver (MarketWatch.com)

Video: Gold expert makes positive case for gold (CNBC.com)

Gold Prices (LBMA AM)

04 May: USD 1,235.85, GBP 958.15 & EUR 1,131.05 per ounce
03 May: USD 1,253.95, GBP 971.18 & EUR 1,148.99 per ounce
02 May: USD 1,255.80, GBP 974.25 & EUR 1,150.19 per ounce
28 Apr: USD 1,265.55, GBP 978.40 & EUR 1,156.84 per ounce
27 Apr: USD 1,264.30, GBP 980.21 & EUR 1,160.63 per ounce
26 Apr: USD 1,264.95, GBP 986.79 & EUR 1,160.21 per ounce
25 Apr: USD 1,270.50, GBP 990.48 & EUR 1,165.81 per ounce

Silver Prices (LBMA)

04 May: USD 16.50, GBP 12.80 & EUR 15.09 per ounce
03 May: USD 16.85, GBP 13.04 & EUR 15.44 per ounce
02 May: USD 16.95, GBP 13.12 & EUR 15.53 per ounce
28 Apr: USD 17.41, GBP 13.45 & EUR 15.92 per ounce
27 Apr: USD 17.46, GBP 13.53 & EUR 16.02 per ounce
26 Apr: USD 17.59, GBP 13.72 & EUR 16.15 per ounce
25 Apr: USD 17.84, GBP 13.92 & EUR 16.40 per ounce


7RealRisksBlogBannerAvoid Digital & ETF Gold – Key Gold Storage Must Haves

Recent Market Updates

- Silver Bullion On Sale After 10.6% Fall In Two Weeks
- London Property Bubble Vulnerable To Crash
- Silver price manipulation, is regulation putting a stop to it?
- Trump 100, Margin Debt Stock Bubble and Gold
- Gold Bullion Imports Into China via Hong Kong More Than Doubles in March
- LePen Euro Frexit Panic Over – “For Now”
- Gold Sovereigns – ‘Treasure’ Trove Found In UK – Don’t Be The Piano Owner
- Silver, Platinum and Palladium as Investments – Research Shows Diversification Benefits
- When Trump Turns On “Enemy Within” Fed It May Create 1970s Style Stagflation
- Silver Production Has “Huge Decline” In 2nd Largest Producer Peru
- Gold Erases Post- Election Fall as Trump Wrong on Dollar
- Perth Mint Silver Bullion Sales Rise 43% In March
- Gold Surges Above Key 200 Day Moving Average $1270 Level

Access Award Winning Daily and Weekly Updates Here

Wednesday, May 3, 2017

Silver On Sale After 10.6% Fall In Two Weeks

Published here: http://www.zerohedge.com/news/2017-05-03/silver-sale-after-106-fall-two-weeks

Silver Bullion On Sale After 10.6% Fall In Two Weeks

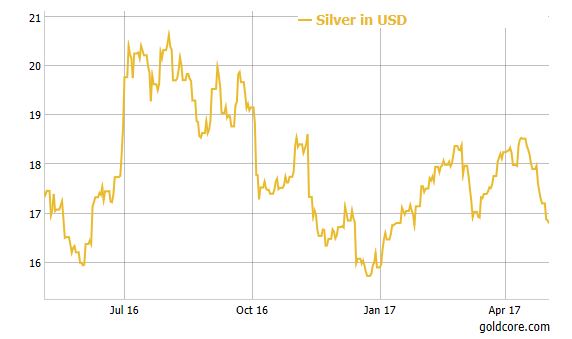
- Silver down for eleven consecutive days to $16.80/oz
- Further weakness possible and support at $15.73/oz
- Never catch a falling knife - dollar cost average
- Silver buyers love manipulative futures selling
- Thank you 'Gold and Silver Cartel' !

Silver in USD (1 Year)

Precious metals continue to weaken, especially silver which has declined eleven consecutive days and is now down over 10.6%.

The sell off is again almost solely a result of futures market participants pushing or manipulating prices lower - depending on your view - despite no bearish silver or wider market developments or news that could be construed as bearish for silver.

It is telling that over the years, there have been very little massive silver and gold futures buying in very short periods of time which has propelled futures much higher. Why is this concentrated trading of futures always on the sell side, pushing prices to the downside?

The questions that arise once again are who was responsible for the sudden bout of selling and was it a bank or fund manipulating prices for their own book and profits or were they acting as a proxy for a central bank.

One way or the other, silver appears increasingly oversold. However, as ever with silver, rather than trying to time the exact bottom with a large lump sum investment or purchase of silver coins and bars, we would caution to "never catch a falling knife."

Instead emulate the 'silver stackers' and keep gradually accumulating silver on artificial price dips.

This is what we are increasingly seeing and we tend to be very busy with silver buyers on price dips. Yesterday was no exception. Indeed, it was the busiest day for silver bullion coin sales in two months.

Silver stackers love manipulative silver futures selling as it allows them to accumulate even more silver bullion coins at discounted prices.

Thank you hedge funds, banks and or 'Gold and Silver Cartel' !


Related Content
- Regulation May Impede Bank's From Manipulating Silver

- “Secret Scheme To Manipulate The Price Of Silver” – Lawsuits Against Banks Proceed

- New ‘LBMA Silver Price’ – Still Not Transparent

- Silver Fixing By Banks Proven In Traders Chats


News and Commentary

Gold near 3-wk low on strong equities, dollar; Fed signal awaited (Reuters.com)

Crowds throng jewellers to buy gold on Akshaya Tritiya across the country (FirstPost.com)

China's Q1 gold output dips 9.3% yearly at 101.2 mt; consumption jumps 14.7% (Platts.com)

Banks Say Price-Fixing Data Errors Buy Them Do-Over (Law360.com)

Sales of luxury new-build homes in London have fallen 40 per cent (CityAM.com)

China’s private-sector debt is 210% of GDP. Source: Money Week

Brace yourself for another panic over China (MoneyWeek.com)

Trump Tries to Save Face After Taking a Thumping on His First Budget Showdown (Bloomberg.com)

China Demands "Immediate Halt" Of US Missile Shield Deployment In South Korea (ZeroHedge.com)

Wall Street’s Earnings Hopium - Stockman (DailyReckoning.com)

40% of Americans spend up to half of their income servicing debt (MarketWatch.com)

Gold Prices (LBMA AM)

03 May: USD 1,253.95, GBP 971.18 & EUR 1,148.99 per ounce
02 May: USD 1,255.80, GBP 974.25 & EUR 1,150.19 per ounce
28 Apr: USD 1,265.55, GBP 978.40 & EUR 1,156.84 per ounce
27 Apr: USD 1,264.30, GBP 980.21 & EUR 1,160.63 per ounce
26 Apr: USD 1,264.95, GBP 986.79 & EUR 1,160.21 per ounce
25 Apr: USD 1,270.50, GBP 990.48 & EUR 1,165.81 per ounce
24 Apr: USD 1,271.80, GBP 991.11 & EUR 1,169.42 per ounce

Silver Prices (LBMA)

03 May: USD 16.85, GBP 13.04 & EUR 15.44 per ounce
02 May: USD 16.95, GBP 13.12 & EUR 15.53 per ounce
28 Apr: USD 17.41, GBP 13.45 & EUR 15.92 per ounce
27 Apr: USD 17.46, GBP 13.53 & EUR 16.02 per ounce
26 Apr: USD 17.59, GBP 13.72 & EUR 16.15 per ounce
25 Apr: USD 17.84, GBP 13.92 & EUR 16.40 per ounce
24 Apr: USD 17.81, GBP 13.90 & EUR 16.40 per ounce


7RealRisksBlogBannerAvoid Digital & ETF Gold – Key Gold Storage Must Haves

Recent Market Updates

- London Property Bubble Vulnerable To Crash
- Silver price manipulation, is regulation putting a stop to it?
- Trump 100, Margin Debt Stock Bubble and Gold
- Gold Bullion Imports Into China via Hong Kong More Than Doubles in March
- LePen Euro Frexit Panic Over – “For Now”
- Gold Sovereigns – ‘Treasure’ Trove Found In UK – Don’t Be The Piano Owner
- Silver, Platinum and Palladium as Investments – Research Shows Diversification Benefits
- When Trump Turns On “Enemy Within” Fed It May Create 1970s Style Stagflation
- Silver Production Has “Huge Decline” In 2nd Largest Producer Peru
- Gold Erases Post- Election Fall as Trump Wrong on Dollar
- Perth Mint Silver Bullion Sales Rise 43% In March
- Gold Surges Above Key 200 Day Moving Average $1270 Level
- Bank of England Rigging LIBOR – Gold Market Too?

Access Award Winning Daily and Weekly Updates Here

Tuesday, May 2, 2017

Are there any patterns between trading gold, and betting markets?

Published here: http://goldsilverworlds.com/articles-gold-dealing-business/patterns-trading-gold-betting-markets/

Trading gold and betting markets; not particularly two things that you would really associate with each other. They operate in different markets and the profiles of the people who do each often differ vastly; however despite these differences, there are actually some trends and patterns that run true in both.

The prospect of financial gain

As with any investment or money staked on a certain event or circumstance, the main motivation for both trading gold and betting is often financial gain. With gold there are a huge number of people and businesses who are there to offer you advice when it comes to trading. These companies provide tips and assistance when it comes to trading in return for you using their platform; this is how they make their money.

This is similar in betting where there is a plethora of websites with tipsters who offer their views on the Champions League and other major sporting markets. They do this in order to attract people to certain platforms from which they generate revenue.

The risk factor

Whenever you place a stake on anything with the prospect of getting a larger return it’s a form of gambling. Even if like some you believe there’s no way your investment can fail, there is always a chance that it will; (in betting the chance of failure is reflected in the odds).

In both gold trading and the vetting markets it’s imperative to fully understand how the market works, otherwise you risk wasting money. Another thing that’s key to understand is the functionality of the platforms used to invest/gamble. This is especially true in betting as there are so many different vendors, each with their own platform.

With all types of trading and betting it’s also important to know when it’s time to get out. There have been many cases across multiple markets where people have gone overboard with their ‘investing’ and ended up with a seriously negative outcome.

Solid Gold markets

Due to its rarity and how difficult it is to fake, gold tends to hold its value even when the financial markets crash. As gold is a physical substance is holds value because it doesn’t rely on third party performance in the same way that the value of stocks and shares do. In fact, even some longer term investments such as property don’t hold their value in the same way that gold does.

The solidity of the gold market is evident in the fact that you still hear about companies (mainly central banks) holding gold reserves. The reason that they do this is to protect themselves in the case of a financial meltdown.

Former UK Chancellor Gordon Brown rather infamously sold off a large proportion of the UK’s gold reserves in 1999 for between $256 – $296 per ounce. This proved a disastrous decision as shortly after he did this the price of gold then rose and at one point was worth over $1800.


The post Are there any patterns between trading gold, and betting markets? appeared first on Gold Silver Worlds.

Are Gold Traders Too Complacent?

Published here: http://goldsilverworlds.com/gold-silver-insights/gold-traders-complacent/

While geopolitical events continue to create market anxiety, gold prices are unlikely to surge higher according to the options market.  In fact, gold options volatility, reflected by the CBOE’s gold implied volatility index GVZ, is nearing a 7-year low, which was last hit, in mid-March.  Current levels reflect market complacency. While it appears that gold prices are sliding sideways waiting for the next impetus to drive them higher or lower, the decline in implied volatility ahead of the French and British elections in May and June respectively reflect that gold option traders believe the status quo is the likely outcome.

Just as a refresher, implied volatility is the markets estimate of how far a security will move over the course of a year on an annualized basis.  Implied volatility is the key component used by option traders to determine the value of an option, based on the likelihood that gold prices will be at a specific level at some point in the future.  An implied volatility level of 11.5%, means that option traders believe that prices will not move more than 11.5% from the current levels, either higher or lower, during the next 12-months.

The low levels of implied volatility tell us that any surprise could lead to a surge in gold prices, but the status quo will keep prices capped.  The decline in options premiums has been driven by declining gold implied volatility, which has set the gold market up for a potential short squeeze if the market is surprised.

Surprises that could shock the market is a victory for French Presidential Candidate Marine Le Pen.  Traders would likely scramble to purchase safe-haven assets if Le Pen was victorious, and gold implied volatility would surge as option traders scramble to cover themselves.

Another political event is the snap general election that was called for by British Prime Minister Teressa May.  If she loses the election, which appears to be a referendum on quickly starting the Brexit process, the pound could soar, and this unexpected event could also drive up gold prices.

North Korea continues to taunt the West, and no one should be surprised if Donald Trump has an itchy trigger finger.  While the consensus is that Trump will use China to help corral North Korea, his bravado is huge, and he is likely to show some form of aggression to let the American people that he is President that nobody can mess will.

Trump has already flip flopped on NAFTA, which has generated choppy market conditions for the Canadian dollar and the Mexican Peso.  Just this week, Trump’s administration told reporters that the President was considering withdrawing from NAFTA which was a campaign promise.  Later in the week, Trump told the American people that he had two very good conversations with both the President of Mexico and the Prime Minister of Canada and decided not to pull out of NAFTA.

Trump is full of surprises and what is currently priced into gold options is that there will be no surprises as implied volatility hits multi-year lows.  A rush to cover options could lift gold prices to 2017 highs, especially if the markets is caught off guard.


The post Are Gold Traders Too Complacent? appeared first on Gold Silver Worlds.

London Property Bubble Vulnerable To Crash

Published here: http://www.zerohedge.com/news/2017-05-02/london-property-bubble-vulnerable-crash

London Property Bubble Vulnerable To Crash

- London property market vulnerable to crash
- House prices in London are falling
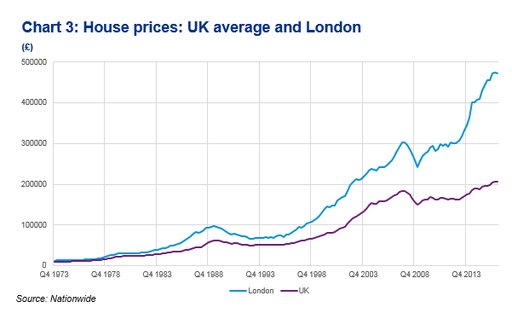
- London property up 84% in 10 years (see chart)
- House prices have risen over 450% in 20 years

- Brexit tensions as seen over weekend and outlook for U.K. economy to impact property
- Global property bubble fragile - Risks to global economy
- Gold bullion a great hedge for property investors

by Jan Skoyles, Editor Mark O'Byrne

For the bargain price of 36 AED (£5) I can buy Global Property Scene magazine, here in Dubai. This month it is running the headline ‘ Could Brexit be the making of the UK Property market?’

Property here in Dubai is a big deal, everywhere you look there are cranes and in the middle of the Malls developers have spent a small fortune placing a stand with a 3D model of their latest development.

The Emirate is looking to position itself as the financial safe haven of the Middle East and with that, they know, comes a solid property market.

London property has long been the poster child for countries such as the UAE who are looking to develop what has for a while appeared to be an indestructible real estate market.

Since 2011 London house prices have climbed by 65%. Between 2006 and 2016, average house prices in the capital grew from £257,000 to £474,000 or by a very substantial 84.4%. These large gains were 'built' on the back of the very large appreciation that was seen in prices between 1996 and 2006 (see chart below).

Average house prices in London in 1997 were below £85,000 meaning that in 20 years prices have risen over 450%.

This has created an air around the city’s property markets - residential and commercial - that they are invincible and that they are a safe haven.

House Prices: UK & London Average (KPMG, March 2017)

But London property values might not be as invincible as the world thinks.

UK’s Land Registry data for three London boroughs shows transaction volumes in London — the number of houses being bought and sold — are at an all-time low. Back in December asking prices in London dropped 4.3% in December with inner London down 6%, more exclusive areas dropped by as much as 10%.

The slump continued into the first quarter this year, a survey by the Royal Institution of Chartered Surveyors found that more agents than not reported price drops in March. London is now one of the five-slowest growing cities in the UK.

London property has for some time had many of the signs of a bubble. However, it is always very hard to pinpoint when a bubble might burst. We are certainly seeing signs that the overheated market is beginning to cool. Of course, all ‘good’ things must come to an end, but what is driving this particular scenario?

In a world of uncertainty what is tipping which scale can be confusing, but there are some factors at play here that are most likely responsible for the downturn we are witnessing.

Does a downturn or bursting of the London property market matter for the wider UK, or the world? Certainly, as with previous bubble bursts, these things are mere tips of much more dangerous icebergs.

Is the market even affordable?

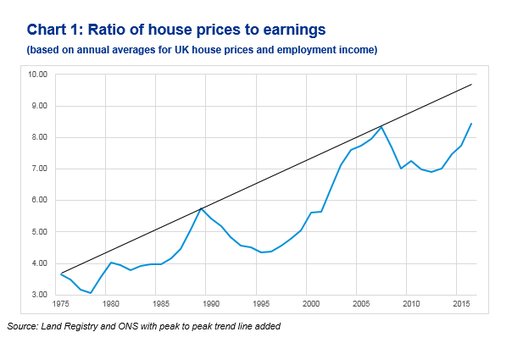
UK house prices are nearly 8.5 times average earnings, a level that the ratio has not been seen at since the last property boom. Yet, on average it has never been financially easier to get a mortgage - with interest rates at record lows in recent years debt servicing levels remain affordable... for now

House Prices to Earnings (KPMG, March 2017)

While KPMG’s research suggests that the house-price-to-earnings ratio is currently below the peak-to-peak trend, it is concerning that it has reached now back at all time record highs.

So as long as interest rates stay ultra ultra low, new borrowing could keep the property market going and keep UK house prices buoyant at least for a while longer.

Since 2013 the average value of London property has risen rapidly relative to rents. For first time buyers and working immigrants the decision to buy comes down to rent prices versus the cost of borrowing, this drives house prices.

So when buyers are optimistic about future house prices, they are generally happy to cover more expensive interest rate payments over rent, if they expect to see a return. This, combined with dinner party conversation over the infallibility in the London housing market, pushes buyers to buy property today terrified in the belief that prices will only get higher.

If record high rents begin to fall - which seems probable given the many global geo-political, financial and economic risks and indeed the risks posed by Brexit to the UK economy - then first time buyers and indeed buy to let investors might decide to hold off buying.

Also, as earnings are not increasing in line with ether inflation or house prices, factors such as Brexit and interest rates (both of which are wrapped up in uncertainty) are beginning to cast a shadow over the London property market. Something which could be disastrous for the UK economy.

Brexit blues dim London property

During the UK’s EU referendum, there were lots of on-the-street interviews with voters arguing that a post-Brexit world would impact the country’s property market. Post-Referendum we are still in a weird limbo as we await to see the result of Brexit negotiations.

In the meantime the rest of world’s financial markets and investors speculate over various uncertainties. This in turn will inevitably impact real estate prices.

The most immediate data we have that shows the impact of Brexit is the slowing of immigration into the UK by those looking to study or work. This was the case even in the run up to the referendum.

This fact is one of the contributors to the cooling off in London house prices. There is a slow-down in demand for not only property to buy but also to rent. Potential buy-to-let purchasers are seeing a slow-down in demand, which reduces the return on their investments.

But international investors (as opposed to immigrants) might not be put off just yet by the London property market. To those holding US dollars or euro, the capital’s real estate might seem to be quite the bargain. In dollar terms property is 16% cheaper 11% so for euro buyers than they were before the referendum due to the sharp fall in sterling. Providing they are comfortable with the considerable currency risk.

As was seen over the weekend and still very high tensions between the May government and the EU, Brexit uncertainties are set to continue. It is the impact of these, and likely further weakening in the pound, which may create further issues for the UK economy.

Is Brexit really an issue?

There is no doubt that Brexit has created some uncertainty in the UK housing market. The recent property prices speak for themselves. Should the Conservatives win the majority in the June election there could be less uncertainty although the negotiations with the EU are likely to be long and hard. There is no guarantee that they will be successfully wound up in even two years time and there is the real risk that they  lead to a significant deterioration in relations between the UK and EU powers and leading EU nations.

A bigger concern for the UK housing market is interest rates. The cost of borrowing has been at record lows for several years. Central banks’ easy money policies, including the Bank of England, have meant that we have seen property prices increase around the world.

The era of record low interest rates was always going to come to an end and the finale is now on the horizon. The Bank of England warned back in February that the post-Brexit value of the sterling which is expected to send inflation to 2.7% this year, will prompt a hike in interest-rates.

If it costs more for buyers to borrow money then this quite simply means that there is less money to be spent on property. The market is already built on the sandy foundations of massive debt suggesting that this is a house of cards that can’t take another layer.

Even where there is real money playing a role, the amount required for a deposit is rapidly becoming unobtainable. First-time buyers are dropping like flies given the increase in deposit amounts; first-time buyer deposits have reached £34,000 across the UK, and nearly £100,000 in London.

In the last few years buyers (both property investors and first-time buyers) have been enjoying the merry-dance of borrow money at a low yield and spending it on the higher-yielding property market. And this isn’t just happening in London, it is happening across the global property market.

The dance has been going on for some time, but it looks as though the jig is about to come to an end, soon these same savvy investors might find themselves with an expensive lump of debt to service, a falling yield on rents and an asset which is worth far less than they had expected.

A problem only to be borne by foreign investors?

Back in January Catherine Mann, the OECD’s chief economist, spoke of vulnerabilities in asset markets. In regard to the UK property market she said this would be good for the country if the fall in prices was borne by foreign investors.

“[What’s] interesting in terms of the implications for the UK economy is who bears the burden - who bears the adjustment cost. If it’s a non-resident then lower house prices could actually be good for the UK.”

However, it is next to impossible that the UK will not feel the pain of the property bubble bursting. Aside from those buyers who will likely be left facing negative equity, unserviceable levels of debt and possible bankruptcy we also need to consider the impact of those who are still borrowing to buy property.

Local councils in the UK aren’t known for their investing prowess.

You just need to look at the Icelandic banking scandal that resulted in UK council being bailed out, for an example. This time around the councils have decided that their local property markets are ones worthy of a punt or two. They may well have been witnessing the optimism that remains amongst estate agents, with more respondents to the RICS survey than not saying they expect prices to climb in the next year.

Local councils are so confident about the strength of the property market that they are borrowing from the Public Works Loan Board (part of the Treasury). Most recently the Isle of Wight has borrowed a whopping £100 million in order to bet on property. Lord Oakshott, Chairman of Olim Property told the Financial Times, “English councils punting on property is an accident waiting to happen.”

“There are real echoes here of Northern Rock, where many punters were lent all the purchase price of a property, and the Icelandic bank scandals, where councils played a market they didn’t understand for short-term income gain.”

Councils overextending themselves (as we saw with Iceland) is not a cost that is later borne by foreign investors. It is borne by those who have to bail them out - the tax payer. We have been here before.

What about supply?

The RICS Chief Economist referred to the ‘flat trend in transaction levels.’ We can spend as much time as we want referring to buyers’ deposits, cost of borrowing and the impact of Brexit but we only do so in reference to demand. This over-heated market was also driven by levels of supply.

A small drop in prices, at levels mentioned in the beginning, means that supply is also likely to slow-down as owners fear they won’t get much return on their investment if they sell now, instead hoping to sit it out and wait for a correction.

Hometrack data shows supply is not keeping pace with sales in Birmingham and Manchester, despite prices set to increase. In London, a stall in prices is more or less inevitable as buyers aren't purchasing houses at the same rate they're being put on the market.

A brief check on a major property website by ZeroHedge found that there might be call for nervousness among sellers and estate agents. Despite discounts on Kensington and Chelsea properties by as much as 40% on those that have been listed for over a year, the number of listings appears to have doubled and little seems to be shifting.

Conclusion - Gold good hedge for property investors

Since the Second World War, UK house prices have only crashed three times, the second time was just ten years ago, then again in 2009 when they hit rock bottom. Since 2013 they have been unstoppable, especially in London.

The belief that they are unstoppable comes from the same drunken optimism the credit crisis came from - one of immortality and the mass delusion at nothing could threaten the property boom we were seeing. Data is now slowly revealing a different picture from the one so many people have been imagining for the last few years.

The property market is certainly seeing a serious cooling down and the question is whether this is the start of serious correction or a crash.

This is not just an event that will be kept local to London. Other "international cities" and major property markets such as Singapore and New York looks bubbly and vulnerable to sharp corrections.

Now would be a pertinent time for investors to review their portfolio allocation to property markets. Even if you do not hold property other than your own home, the bursting of the bubble will no doubt impact the global financial system, not to mention the national economies to which they are so intrinsically tied.

If property market corrects sharply or crashes, companies, councils and irresponsible lenders will need to be bailed out. Who will be footing the bill? We will. For reasons already explained by events played out during the financial crisis,  it would be prudent for readers to consider how much exposure they have to not only the property market but also the banking system and the banks that have considerable exposures to property markets.

It is difficult to hedge property investments effectively. However, in our modern globalised world where interest rates and economic cycles are increasingly correlated, gold will likely become an excellent hedge for property investors in the coming years.

Property prices look over valued in many markets internationally today and in the event of price falls, gold is likely to act as a hedge and preserve wealth as it has done throughout history.

Investors should decide on a reasonable allocation to gold bullion, held in allocated and segregated storage in less debt laden jurisdictions.

Owning these assets outside of the digital and the financial system, away from the shaky, debt-fuelled banking system funding the overheated property markets will soon be seen as prudent.

Related Content

Insight - Is London’s Property Bubble Set To Burst?

London and UK Property Bubble Beginning To Burst

Global and London Property Bubble Set To Burst – UBS and Deutsche Warn

7RealRisksBlogBannerAvoid Digital & ETF Gold – Key Gold Storage Must Haves


News and Commentary

Gold up in Asia on risk, copper down sharply after PMIs (Investing.com)

Gold steady on stronger equities, dollar (Reuters.com)

Asia Stocks Rally on Earnings Views; Aussie Climbs (Bloomberg.com)

U.S. factory activity slows; inflation pressures subside (Reuters.com)

Gold prices mark 3-week low (MarketWatch.com)

The “Retail Apocalypse” Is Here (DailyReckoning.com)

Trump Weighs Breaking Up Wall Street Banks, Raising Gas Tax (Bloomberg.com)

Biggest Gold Miner ETF Just Saw Largest Outflows on Record (Bloomberg.com)

Time to Buy Gold Miners? (Barrons.com)

Why this fintech tycoon is worried about Brexit (MoneyWeek.com)

Gold Prices (LBMA AM)

02 May: USD 1,255.80, GBP 974.25 & EUR 1,150.19 per ounce
28 Apr: USD 1,265.55, GBP 978.40 & EUR 1,156.84 per ounce
27 Apr: USD 1,264.30, GBP 980.21 & EUR 1,160.63 per ounce
26 Apr: USD 1,264.95, GBP 986.79 & EUR 1,160.21 per ounce
25 Apr: USD 1,270.50, GBP 990.48 & EUR 1,165.81 per ounce
24 Apr: USD 1,271.80, GBP 991.11 & EUR 1,169.42 per ounce
21 Apr: USD 1,281.50, GBP 1,000.85 & EUR 1,197.31 per ounce

Silver Prices (LBMA)

02 May: USD 16.95, GBP 13.12 & EUR 15.53 per ounce
28 Apr: USD 17.41, GBP 13.45 & EUR 15.92 per ounce
27 Apr: USD 17.46, GBP 13.53 & EUR 16.02 per ounce
26 Apr: USD 17.59, GBP 13.72 & EUR 16.15 per ounce
25 Apr: USD 17.84, GBP 13.92 & EUR 16.40 per ounce
24 Apr: USD 17.81, GBP 13.90 & EUR 16.40 per ounce
21 Apr: USD 17.98, GBP 14.05 & EUR 16.80 per ounce


Recent Market Updates

- Silver price manipulation, is regulation putting a stop to it?
- Trump 100, Margin Debt Stock Bubble and Gold
- Gold Bullion Imports Into China via Hong Kong More Than Doubles in March
- LePen Euro Frexit Panic Over – “For Now”
- Gold Sovereigns – ‘Treasure’ Trove Found In UK – Don’t Be The Piano Owner
- Silver, Platinum and Palladium as Investments – Research Shows Diversification Benefits
- When Trump Turns On “Enemy Within” Fed It May Create 1970s Style Stagflation
- Silver Production Has “Huge Decline” In 2nd Largest Producer Peru
- Gold Erases Post- Election Fall as Trump Wrong on Dollar
- Perth Mint Silver Bullion Sales Rise 43% In March
- Gold Surges Above Key 200 Day Moving Average $1270 Level
- Bank of England Rigging LIBOR – Gold Market Too?
- Pension Crisis In U.S. and Globally Is Unavoidable

Access Award Winning Daily and Weekly Updates Here

Monday, May 1, 2017

Manipulation's Persistence and Comex' Demise

Published here: http://www.zerohedge.com/news/2017-05-01/manipulations-persistence-and-comex-demise

 Manipulation's Persistence and Comex' Demise


  • Comex Demise is a welcome event
  • How Market Structure Impedes True Metals Price Discovery
  • DGCX/ SGE Rising: The GoldenYuan Replaces the Petrodollar
  • Manipulation's Persistence

via Soren K Group and MarketSlant

Warning: Humor, sarcasm, and  an ability to discern conjecture from fact are needed. While facts may be undiscoverable, truth is not. The end game is not path-dependent. The Comex is dead and metals will rise in part aided by manipulation.

Other Warning: We are on the road and apologize in advance if this post is a little more disjointed than usual. It is really 4 stories in one.

COMEX DEMISE / METALS MARKET STRUCTURE 

The Long Good Bye

The Comex should be put out of its misery now. It's a toxic albatross around the CME neck. It has no reputable brand to market overseas. It is a walking liability. If you think the LBMA has lost its credibility due to the banks pulling their flow and the Fix becoming untethered to reality; then wait until the Comex contracts die a slow, painful, denial laden death. It will likely recede into the fade.  Or worse, it will explode in the CME's face.

Out With a Bang?

It could end with a bang. Imagine if someone took delivery all at once. This would play on the  Fractional Reserve Banking market structure in place for decades. The difference in size between actual metal and derivatives traded on Gold and Silver created the opportunity and framework for price manipulation for decades.

This is not to blame the derivatives market. It is simply to say, when the derivative market is larger than the real underlying, there is opportunity for "tail wagging dog" manipulation. When you combine this market structure with compensation incentives and "blind eye management you have the perfect mix for manipulation.

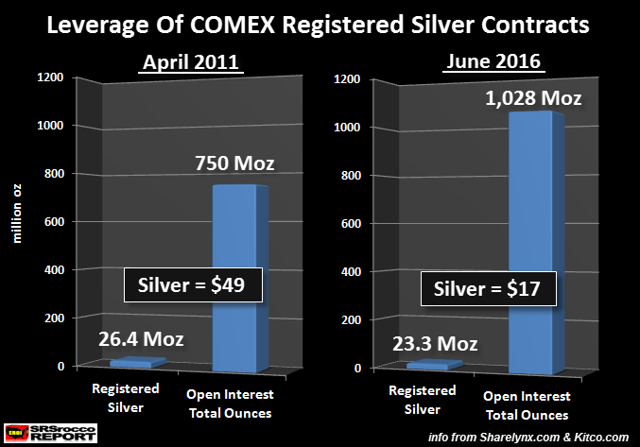
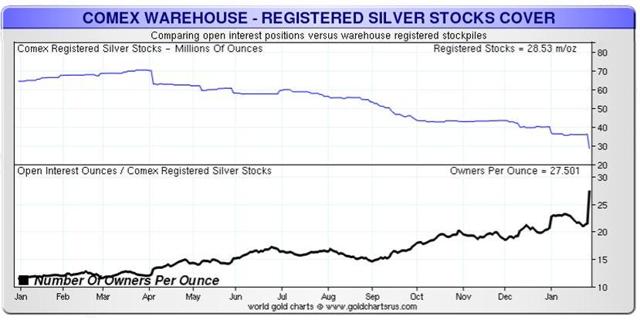
Simply put, deeper pockets have and continue to lever themselves to make themselves right. Now imagine if legacy positions had to be unwound. Four claims for every 1 ounce of metal. Think "It's a Wonderful Life" but Mr Potter winning. 

Using silver as an example. Add up the total amount of paper silver traded on a single day from both  US exchanges and you get about 950MM ounces of silver traded. Compare that with the approximate 900MM ounces a year that is mined. Get it?

Now look at the Comex  silver vault  actual,versus potential claims against that silver.

This can openly end when someone stands for delivery. But do not  hold your breath. Also keep in mind that much of the physical that has come out of the Comex vaults is now in Asia by way of London. 

Corporate Lobbied Market Structure is the Enemy

The "Take delivery of ALL the Silver" situation will not happen. It won't happen until the ROR (and exit risk) for cash-and-carry play is better than the ROR on levered 'short cons'. Even then, the regulatory risk is too great.

Look at it this way. You have to borrow stock to short it. You need that stock up front to be able to short it. If it is not available, you cannot short the stock. Meanwhile, the long who makes his stock available for shorting gets paid interest on his "loan". Even more, the bank holding that stock will give leverage of 2x or more for the cash value of that share of stock.

Conversely,in precious metals, you can short Gold without borrowing it first. And the 'long' must declare intent to take delivery come first notice day. Only then does the "short' have to decide if he wants to make delivery or cover in the open market. And as to collateral value? Forget leverage. if you keep your metal in abank, you'd be lucky to get 50% of its value in collateral. 

For example, Buffet in 1997 - Remember when the Government begged Warren Buffet to NOT take delivery from improperly hedged producers in 1997? -  What a swell guy. He loaned it back to them at 40% interest. He NEVER intended to take delivery. He sold in the $8.00 area and was ironically front run by bullion banks on his exit.

COMEX DEMISE / GOLDENYUAN RISE

Vaya con Dios Comex

Dubai's Gold Exchange (DGCX) is now listing the Shanghai Gold Futures contract. 

So Comex will fade away. What is bearish for Comex, is however bullish for Gold and Silver. Here is the DGCX's Product Description:

China is known as the one of the biggest gold producing and consuming countries in the world. It is also one of the top two importers of gold globally. Traditionally, China has been deficient in gold investments at both the sovereign and investor level. Gold consumption in China has risen significantly with consistent purchases by the Government of China. The government has also encouraged the Chinese public to invest in gold and use it as an instrument for their savings.

Dubai has historically been a central hub for gold trading in the MENA region. The China Belt and Road initiative also passes through the region and holds strategic value for both China and the UAE. A large part of the trading community in the Americas, Europe and Asia are keen to participate in Chinese physical and derivative markets. At the same time the Chinese government wants to increase the acceptance of Chinese Yuan and the Chinese Gold price benchmark prices globally. The launch of the DGCX Shanghai Gold Futures Contract provides all stakeholders including the government in China, UAE and Dubai, market participants, SGE and DGCX a suitable opportunity to progress together on the chosen path with one singular goal.

  • Tracks and prices the largest Gold market in the world by production and consumption
  • Settlement based on the Chinese Gold benchmark Price as declared by the Shanghai Gold Exchange (SGE) - in Yuan Bitches = Comex Nail
  • Traded and Cash settled in Chinese Yuan (CNH) - see above
  • Zero Capital Gains Tax and Zero Corporate Tax - Tax Arb =  Comex Nail
  • Contract size of 1000 grams (1kg); Tick Value of CNH 10
  • Efficient margining for optimal leverage - Bullion dealers and  PBOC will use that for price control when they need to buy
  • Trade your view on the Chinese Gold market - or alternately, your view on the US Comex
  • Trade the spread between Shanghai Gold and correlated Gold products listed on DGCX = Comex Nail
  • The margin offsets by DCCC for inter-commodity spreads offers greater capital efficiency - Arab oil profits buys chinese gold, bullion dealers arb it with cross margining. -= US Oil and Gold contract Death 

Comex demise and DGCX success are Bullish for Gold and Silver. This is because the Asian players ARE taking delivery of Gold and Silver. This is in part because of the Petrodollar's coming demise.  From Connect the Dots 

Then : Gold >  USD > PetroDollar 

  1. Create Gold Demand: 1944 we steer world towards gold for good reason (we have it, and Germany's lack of Gold was the cause for WW2)
  2. Inflate Debt: 1971 we have to monetize debt to pay for wars in vietnam and korea > go off gold standard
  3. Create USD Demand: 1974 cut Arab deal USD for Oil > we sell them military arms, they buy UST

Now: PetroDollar > Gold / PetroYuan

  1. Arabs have their own strong army, US not buying as much oil, China wants more Oil 
  2. China wants to replace USD as world reserve, Arabs want to sell more oil (without shale competition)
  3. Arabs cut deal to sell oil to china in Yuan. Arabs will buy gold with Yuan
  4. Arab world increasing trust in China, Russia a product of implicit backing of currencies with Gold
  5. Arab world increasing mistrust of US intentions- ambivalent to US policies

Endgame- Arabs get to sell oil locally to China and Russia. avoid shale oil competition in U.S. This is underpinned by Yuan and Rubble implicit backing by Gold, increasing mistrust of US, especially since Saudi's don't need our weapons any more. 

So, the levered shorts are beginning to feel the pain now.

MANIPULATION'S PERSISTENCE / MARKET STRUCTURE

Manipulation Finds a Way

The question is, how do the shorts fight back? That answer is a version of what was done in the West. When everyone is finally done buying, the players lobby for leverage, higher margins, and institutionalize micro advantages to being short.  This will happen. Perhaps in 100 years, after China has transitioned from USD peg to (implicit) Gold peg,.and then to its own PetroYuan. When it needs more leverage, it will undo its Gold peg and debase the Yuan.  In the mean time, manipulation will increase in the Far East via spoofing lower, and price-gouging higher. Just like it happened here for 50 years.

Comex Fleecing Regulated Now? Move to Asia

Hopefully, the free markets will kill Comex for us. And those bullion banks, brokers, producers, players ( talking to you Buffet, Soros, et al) that have cooked prices for years, will start to cook them on other exchanges. Manipulation is not dead. It has just moved East.

LME's "liquidity provision" program is nothing more than a level 1 ECN for old LBMA dealers to  "transparently" lean on their own order book.

If only those firms had no order flow, then we'd see what great traders they really are. We remember one time when a bullion bank trader was unhappy with his bonus. He foolishly approached the MD and complained in front of the group on their trading floor .The MD crushed the trader.  

'Do you think you made the money for us?' he reportedly shouted. 'This chair you sit in made the money. I can put anyone I want in this char with basically the same results. The order flow we provide for you is why you are profitable. The chair is the money maker, not you!'

But we digress

Skin the Comex? Why Not! 

Dear U.S. Bank with a lot of physical Metal: After relocating all your allocated silver to some vault in Asia, feel free to lift your Comex hedges, then get long, and then announce you are taking delivery on Comex. Then re-apply your hedges in Asia, sell the backwardation on Comex  (like Buffet did) and walk away from the exchange. 

We understand that you don't want to give up your US "rule of law" protections. We also know you'd rather not be subject to a DOJ investigation. So feel free to fire a couple traders and seed their new hedge funds. Then do all your deals with them via a  closely held Singapore shell in which you control the voting shares. And it would help to have one of your own be on a US regulatory body. Even better, convince a Chinese national to do it as a client. Fees, storage, marketmaking profits, and no risk. the US cant extradite a Chinese national. Think of Buffet, but with balls.

And learn from DB's mistakes. They had to turn traitor to their co-conspirators in their own metals fraud because of more pressing (DOJ) issues. Why else would they sell their vault business to China 2 years after opening it?

So go for it! Kill the Comex. Don't worry about regulators. Remember, Government can be bought, or at least rented.

Government: Here to Help

Do you, the reader not think the banks and/or the government influence the timing of margin calls? Do you believe that an exchange will not do everything in its power to rescue the player with the largest marketshare at the expense of its own counterparty diversity? Worked for POTUS in 2009.

Barack Obama inverted contract law when he "rescued" GMAC and Chrysler bondholders.

From the Cato Institute 

..... the Obama administration in 2009 bullied Chrysler’s secured creditors—who were entitled to “absolute priority”—into accepting 30 cents on the dollar, while junior creditors such as labor unions received much more. This subversion of creditor rights violates not just bankruptcy law, but also the Constitution’s Takings and Due Process Clauses.

Do you think a regulatory officer would be less risk to violate the law? We know from experience the answer to that is an emphatic NO. Ask any eczema- laden compliance officer you know. So, it's all good Bullion Banks. Just make sure you have a couple guys to throw under the bus.

In other EXCHANGE NEWS

ICE completed TMX Atrium all-cash acquisition. Financial impact will be immaterial to ICE.

SGX offered to open its clearing infrastructure to APEX, a new Singapore commodity futures exchange backed by a Chinese hedge fund. Reported by the Financial Times.

LSE purchased 67.0k shares at 3,366p per share, as part of its £200m repurchase program. Total purchases add 1.10m shares up to date.

NZX revenues from continuing operations increased 3% y/y to NZ$18.6m.

Calypso and R3 are testing their FX trade matching solution on Corda distributed ledger technology (DLT) platform.

DGCX: the recently launched Shanghai Gold Futures contract helped DGCX see a boost in precious metals trading in April.
 
Bloomberg is partnering with Twitter to launch a streaming television news service on the social networking platform, according to WSJ. The channel is expected to begin operations this fall.

SEC: Senate will cast an initial vote today on Jay Clayton’s nomination as Chairman of the SEC.


Just Sayin'

Dear CME

Comex is a liability. The demand is now Eastern. The vaults are going east. The Banks are trading Far Eastern time. The price premium to spot is Asian. The money to be made is in the east. The  retail are newly minted middle class Chinese, and Singapore citizens. 

 You know that exchanges ultimately succeed in regions of commodity demand. And you are expert in ring-fencing your liquidity pools. Time to be more aggressive in porting your franchise to Asian markets maybe.

So how are you going to do it? Acquisition? Partnership? Because next up is the Oil business. The global benchmark is already Brent and moving further east as we speak.  

We know 70% of your revenue comes from interest rate products. We also feel strongly that CME is a buy as interest rate risk becomes a bigger factor. So you can afford to wait here as a company. But do you really want to? Effort at the margin is so little to preserve your commodity franchises. Maybe we are wrong. 

Comex - The Hope Diamond of Exchanges

The Comex was cursed with ineptitude and corruption from the beginning.  Did you know they had the S&P 500 index offered to them, but turned it down? But that's not all. 

  • Tax straddles - actually saw an ashtray that said "Tax Straddles Save Lives" - or something to that effect
  • Hunt Brothers' Forced Out -  Government usurping the free market ordering "liquidation only" to save the silver producers and bullion dealers -  and all board members who were short.  
  • The "Red seat / Green Seat" fiasco(s)?  - NMX and then CME were blackmailed by members to get paid as equity holders. - We recommended the "seat arb" to a client based on the exchange ineptitude and it paid off. Vincent Viola truly inherited a headache there.

Remember in 2011 when Shak and other spread traders were manipulated out of their jobs by cooked spreads?- That case isn't over yet. And it is likely the last decent con of Comex participants we will ever see, unless...

Silver Takes the Elevator Down, Report 30 April, 2017

Published here: http://www.zerohedge.com/news/2017-04-30/silver-takes-elevator-down-report-30-april-2017

Last week, we talked about the effect of the French election on the gold and silver markets, and noted:

Of course, traders want to know how this will affect gold and silver. As we write this, we see that silver went down 30 cents before rallying back up to where it closed on Friday. Gold went down about $20, and then half way back up.

At this point, we are not sure if the metals are supposed to go up because more printing. Or go down because the euro constrains France from printing. Or silver at least should go up because the economy is going to be better with France remaining in the Eurozone. Or go down because the ongoing malaise will only progress as it has been. Or some other logic… and the price gyrations this evening show that traders don’t agree either.

It didn’t take too long. Here is what happened to silver this week. The graph below shows the price of silver in real money (i.e. gold).

The Price of Silver in Real Money

Silver has been falling for going on one year, but clearly since March 1. After one last hurrah at the end of March, it has been taking the elevator down. And by its fundamentals it should be quite a bit lower—0.0125.

In any case, we are interested in watching what the fundamentals of the metals are doing. We will take a look at the graphs below, but first, the price and ratio charts.

The Prices of Gold and Silver

Next, this is a graph of the gold price measured in silver, otherwise known as the gold to silver ratio. It had another major move up this week, after a major move up last week.

Last week, we said:

If prior peaks are an indication, there may be a spot of resistance at 72.5 (+0.8 above Friday’s close) and another at 73.25. If the ratio should go over these levels, then it may go all the way to its fundamental level (discussed below).

Well, it broke those levels and ended the week just under 74.

The Ratio of the Gold Price to the Silver Price

For each metal, we will look at a graph of the basis and cobasis overlaid with the price of the dollar in terms of the respective metal. It will make it easier to provide brief commentary. The dollar will be represented in green, the basis in blue and cobasis in red.

Here is the gold graph.

The Gold Basis and Cobasis and the Dollar Price

The scarcity (i.e. the cobasis, the red line) was on the rise this week. It makes sense, that as the price of gold drops (which is the mirror of what this graph shows, the price of the dollar in gold milligrams) the metal becomes scarcer. This means speculators are selling their paper. If owners of metal were selling, then the metal would not become scarcer and might even become more abundant.

However, it only became a little scarcer while the price dropped almost twenty bucks. So our calculated fundamental price fell $15 to $1,274, a few bucks above the market price.

Now let’s look at silver.

The Silver Basis and Cobasis and the Dollar Price

In silver, the price fell a lot. 72 cents. The cobasis rose (i.e. abundance dropped and scarcity increased).

Last week, we asked:

Some speculators definitely got flushed. However, the question is how many and how much?

Clearly it happened to more of them this week. And, unless the fundamentals get stronger, it is likely to flush even more leveraged futures positions. Our calculated fundamental price fell three cents this week, now a buck thirty under the market.

© 2017 Monetary Metals