Monday, November 30, 2015

Will a GDP Futures Market Be Liquid?

Published here: http://www.zerohedge.com/news/2015-11-30/will-gdp-futures-market-be-liquid

by Keith Weiner


At the Cato Monetary Conference this week, Scott Sumner said he had a “modest” proposal, that there should be a highly liquid futures market in Nominal Gross Domestic Product (NGDP).  This caught my attention, as the futures market is a topic near and dear to my heart (I write about it every week).

Sumner is known for his view that the Fed should target NGDP as the basis for monetary policy. So a futures market that predicts it would be convenient. Let’s look at his idea more closely.

What, precisely, is to be traded? If I buy an NGDP future, what is delivered at contract maturity? It’s clear what I get when I buy a wheat future or crude oil future. With Nominal GDP futures, there’s nothing to receive because NGDP is not a commodity or even a security.

A futures contract is a derivative, but an NGDP future would not be derived from anything.

So how is an NGDP contract supposed to settle? The only thing I can think of (Sumner doesn’t say) is that the NGDP contract will pay based on the published NGDP number. For example, if NGDP comes in at $19T, then the contract might pay out $19,000 (depending on how many NGDP units are represented by the contract).

GDP numbers are revised a few times after they are published. Is the NGDP contract to pay when the initial number comes out, even though it might be wrong? Or will NGDP be the only contract where both parties’ capital must be locked up for months until the Bureau of Economic Analysis publishes the final number?

Moving on to the next problem, let’s look at a real futures contract like wheat. Suppose the bid price on a March wheat future is $7.00 and the ask price on spot wheat is $6.50. There’s 50 cents of profit to anyone who can buy wheat in the spot market, sell it in the futures market, and store it for the duration. This is called carrying, which is an act of arbitrage.

Arbitrage anchors the price of wheat futures to the price of wheat in the spot market. Both prices can move up and down in response to changes in supply (demand being pretty stable in wheat) or speculation that supply will change.

By contrast, the NGDP market is for speculators only. It has no connection to a real price, and no arbitrageurs. I am all for making gambling legal, if people want to bet on NGDP, the weather, or the horse race. But that’s not Sumner’s point. He believes that this market will predict NGDP accurately enough to manage the economy without causing recessions and depressions.

Sumner declares this market won’t merely be liquid. It will be highly liquid. Let’s consider that.

Each market has a different degree of liquidity. The liquidity comes from the character of the thing being traded, not from a government proclamation. For example, copper is more liquid than lumber. Silver is more liquid than copper and gold is more liquid than silver.

A liquid market has a continuous bid and ask. That does not mean someone is always buying or selling. On the contrary, it means someone stands ready to buy or sell at any time. Who and why?

In my wheat example, I mention the carry arbitrage. Suppose the cost to carry—interest and storage—is 30 cents. Each trader has to decide his minimum profit threshold. Suppose Joe is willing to do it for 20 cents. He needs to get at least 50 cents on the deal. He can sell a March for $7.00, which is why he bids $6.50 on spot. Joe will not pay one penny more, unless the price of March wheat goes up.

Joe and his competitors are why there’s always a bid (and ask) in wheat.

Obviously, there is no carry arbitrage with NGDP futures. There won’t be much liquidity either.

An NGDP market may convenient for monetary planners, but without a reason to exist it won’t work the way Sumner hopes.


This article is from Keith Weiner’s weekly column, called The Gold Standard, at the Swiss National Bank and Swiss Franc Blog SNBCHF.com.

Gold Demand in China Heading For Record and Reserves Increase 14 Tonnes In October

Published here: http://www.zerohedge.com/news/2015-11-30/gold-demand-china-heading-record-and-reserves-increase-14-tonnes-october

Gold Demand in China Heading For Record and Reserves Increase 14 Tonnes In October

While gold prices continue to languish in the doldrums and are on course for their worst month since 2013, global demand and especially Chinese retail, investor and official demand continues to remain very robust. Indeed, China looks likely to see a new record demand for gold annually again in 2015.

Shanghai Gold Exchange (SGE) deliveries as reported last Friday were again very robust with another 54.063 tonnes of bullion deliveries for the week ending November 20th. Shanghai Gold Exchange (SGE) deliveries remain the best indicator or proxy for actual Chinese demand and appear to show Chinese gold demand is heading for a new record in 2015 (see charts below).

China added another 14 tonnes or 450,000 troy ounces of gold bullion to its foreign exchange reserves in October.

Gold reserves rose to 1,722.5 metric tonnes or 55.38 million troy ounces at the end of October. This was up from 54.93 million at the end of September, data from the People's Bank of China (PBOC) showed today.

China’s increasingly powerful central bank has been adding between 14 tonnes and 19 tonnes of gold every month. The strong demand and positive view of gold comes as the country looks to diversify its massive foreign exchange reserves of over $3.5 trillion.

China’s diversification into gold was again healthy and robust in ounce or weight terms but remains small in dollars terms at just $477 million at today’s prices - 0.00136% of fx reserves or 1.6% of fx reserves on an annualised basis.

China’s sharp devaluation of the yuan this summer sparked another gold bar and coin “buying spree” in China according to the World Gold Council in their recent Gold Demand Trends report. Prudent Chinese store of wealth buyers are again protecting their wealth from volatility and sharp falls in stock markets and indeed in some property markets.

Contrary to the widely held belief that gold bullion demand is subdued, it is actually very robust and, indeed, surging in key markets such as China. Data shows that surging demand for coins and bars and a rise in buying by central banks pushed physical gold demand up 7% in the third quarter. Demand for gold coins and bars jumped by 26% year-on-year in the last quarter, GFMS analysts at Thomson Reuters reported in the Q3 update of their Gold Survey 2015.

Retail investment surged in top buyers China, India and Germany - rising 26 percent, 30 percent and 19 percent respectively. Those three markets alone accounted for an additional 26 tonnes of bullion buying.

This data was confirmed by the World Gold Council. Their data shows global investment demand saw a significant rise of 27% to 230 tonnes, up from 181 tonnes in Q3 2014. Overall demand increased by 8% year-on-year to 1,121 tonnes as selling of futures contracts and ETFs contributed to a price dip, 6% in July, which buoyed gold bullion demand around the world.

Another example of how large concentrated liquidations in the futures market on the COMEX is for the moment leading to lower prices - artificially so - was seen in trading on Friday after the Thanksgiving holiday on Thursday.


More peculiar trading on the COMEX was seen when 18,000 gold futures contracts, worth nearly $2 billion, were dumped on the market at a time when the market was less liquid (See chart).

The nature of the selling again appeared to suggest that the seller may not have a profit motive in mind. The selling did both psychological and technical damage to gold. Gold sentiment already battered will not have been helped by the move and technically gold prices have fallen below what Goldman Sachs and others see as a "crucial level" technically.

As has been the case on a number of occasions in the course of gold’s bull market, gold prices are ignoring positive real world physical supply and demand factors as the futures market wags the tail of the gold dog.

We expect very robust Chinese and global bullion demand to bark soon and re-assert themselves and speculative players short the market may incur a nasty bite as will those with no allocation to physical bullion.

The deterioration in the fundamentals of the global economy are so important that the Fed are suggesting that they will increase interest rates.

Despite this, all eyes are again on the Fed and the possibility of a meager 0.25% interest rate rise. The Fed has been suggesting that this would happen for many months and, as ever, it is always best to watch what they do rather than what they say.

Ignore the noise of the Fed and continue to focus on the long term fundamentals driving the precious metals market. Even if they do increase interest rates today, negative real interest rates look set to continue for the foreseeable future.

Gold’s long term diversification value and benefits continue to be largely ignored in favour of simplistic analysis and a superficial focus on gold’s nominal price action in solely dollar terms.

Short term speculators and weak hands have again been washed out of the futures market due to the recent price weakness and many speculators are now short due to the poor technicals.

Prudent investors will continue to gradually accumulate physical bullion on dips like the Chinese. Given the variety of macroeconomic, systemic, geopolitical and monetary risks in the world today, owning gold and silver bullion in the safest vaults in the world has never been more prudent.

Read more on GoldCore.com


DAILY PRICES

Today’s Gold Prices: USD 1055.65, EUR 998.20 and GBP 703.05 per ounce.
Friday’s Gold Prices: USD 1064.65, EUR 1005.79 and GBP 707.73 per ounce.
(LBMA AM)

Gold in USD - 10 Years

Gold lost $12.00 on Friday closing at $1058.60, down 1.73% overall for the week.  Silver closed at $14.10, down $0.09 which is a 0.56% loss for the week.  Platinum continued its slide losing $15 on Friday, closing at $833.


IMPORTANT NEWS

Gold prices under pressure as dollar climbs – The Bullion Desk
Gold Heads for Worst Month Since 2013 as Central Banks Diverge – Bloomberg
Gold poised for worst monthly dip in 2-1/2 years – Reuters
Holiday shopping unlikely to cheer many investors – Reuters
IMF to make Chinese yuan reserve currency in historic move – The Telegraph

IMPORTANT ANALYSIS

“Very bullish outlook for the gold industry” – Bloomberg
Is This The Gold Cartel’s End Game? Gold Eagle
Paul Craig Roberts On Gold and “Massive Government Corruption” – ZeroHedge
Thanksgiving amid the Threats of War and Terrorism – Maudlin – Goldseek
Economy needs more than Luck – We Need a Plan B – McCarthy – Independent
Elites still can’t see just how much damage they are doing – Independent
Even after rate hike, Fed will probably keep rates unusually low for years – Bloomberg

Read more News & Commentary on GoldCore.com

Essential Guide to Storing Gold Offshore

Download Essential Guide To Storing Gold Offshore

Breaking News and Research Here 

Follow GoldCore on TwitterFacebookLinkedIn

Are Silver Prices About to Hit $50?

Published here: http://www.profitconfidential.com/silver/are-silver-prices-about-to-hit-50/

Silver prices may be down, but the precious metal shouldn’t be shunned by investors. Silver could be presenting a great opportunity for long-term investors.

I follow one rule of investing; when not a lot of things make sense, go back to the basic economics of supply and demand. This has never failed me. Looking at silver in this perspective tells me the precious metal could be setting up for a massive price jump.
Silver Demand Remains Extreme at Mints Around the World
So far this year, the U.S. Mint (up until November 19) sold over 42.9 million ounces of silver in.

The post Are Silver Prices About to Hit $50? appeared first on Profit Confidential.

Sunday, November 29, 2015

Will Next Week Be The Start Of The Crash Of The US Dollar?

Published here: http://www.zerohedge.com/news/2015-11-29/will-next-week-be-start-crash-us-dollar

Amerikaanse dollar stijgen en dalen

The year 2015 is coming to an end and we’ve seen a lot this year. Not only did we see a much stronger dollar, the gold price also weakened despite the dire economic situation in, well, everywhere in the world, terrorist attacks and additional tensions between a NATO member and Russia. Additionally, the Federal Reserve seems to be on track to increase the interest rate before the end of this year. In fact, as you can see on the next chart, gold has now almost reached a 6 year low, but two important indicators are indicating the yellow metal might have been oversold lately.

Gold price

Source: stockcharts.com

An increased interest rate theoretically means a currency would become even stronger as there would be a higher demand for the US Dollar, especially in the current near-zero interest rate environment all over the world. However, there are additional elements at play here.

From Monday on, it’s not unlikely the US Dollar will see its ratio in the Special Drawing Rights basket being reduced in favor of the Chinese Yuan. Earlier this year, China has openly demanded the IMF would include its currency in the basket considering the country’s economy now is one of the largest in the world. There were quite a few people who doubted this would effectively happen, but China has made all the necessary steps as it promised a better market transparency and has even provided an updated status of the total amount of gold on the balance sheet of the Central Bank (and whether or not that’s the true number remains open for discussion. A long discussion.).

China Gold

Source: bullionstar.com

We expect the IMF to confirm on Monday the Yuan will indeed be included in the SDR basket, and this could weaken the position of the US Dollar around the world. One of the main reasons why the US Dollar gained a lot of strength lately wasn’t because of the ‘strong’ economic situation in the USA, and it wasn’t because the market was anticipating a rate hike. No, the US Dollar was appealing as a world reserve currency because it was worldwide seen as a safe currency but now the Yuan is being accepted by the IMF as part of its Special Drawing Rights basket central banks all over the world might be tempted to convert some US Dollars into Yuan as the Chinese currency will gain a lot more credibility and legitimacy overnight due to the decision of the IMF.

US Dollar Index

Source: stockcharts.com

Even the chart of the US Dollar Index shows some signs of fatigue. After the most recent run, the Relative Strength Index has almost reached an ‘overbought’ status whilst the MACD is about to make a negative crossover. These two indicators could point in the direction of a weaker US Dollar in the next few weeks.

In a previous column at Secular Investor, we already expressed our surprise about some weird trading patterns in the foreign exchange markets, and now the Yuan will probably be added to the SDR basket, we might see some more ‘weird’ swings. Is it time for a 'Dollar crash'? We wouldn't be surprised if it is.

The US Dollar might have reached the top of its strength and could see a downward correction in the next few weeks.

>>> Click here to read our Guide to Gold FOR FREE

Secular Investor offers a fresh look at investing. We analyze long lasting cycles, coupled with a collection of strategic investments and concrete tips for different types of assets. The methods and strategies are transformed into the Gold & Silver Report and the Commodity Report.

Follow us on Facebook @SecularInvestor [NEW] and Twitter @SecularInvest

Saturday, November 28, 2015

Weekly Gold Market Review For November 27

Published here: http://goldsilverworlds.com/investing/weekly-gold-market-review-for-november-27/

In his weekly market review, Frank Holmes of the USFunds.com summarizes this week’s strengths, weaknesses, opportunities and threats in the gold market for gold investors. Gold closed the week at $1,057.98 down $19.90 per ounce (-1.85%). Gold stocks, as measured by the NYSE Arca Gold Miners Index, lost 0.03%. Junior miners outperformed seniors for the week as the S&P/TSX Venture Index climbed 0.14 percent. The U.S. Trade-Weighted Dollar Index gained 0.47 percent for the week.

Gold Market Strengths

Silver was the best performing precious metal this week with a slight decline of 0.6%.  Short sellers apparently did not care if silver traded lower as over 18,000 gold contracts, or $1.9 billion notional, was  dumped in overnight markets.

Silver-price_chart-2009_2015

James Steel, chief precious metals analyst at HSBC, sees gold’s trading range at $1,025 to $1,275 for 2016, according to a November 24 report. Further 2016 forecasts from Steel include demand exceeding total supply, mine production falling and jewelry demand climbing.

The U.S. Mint has sold out of its 2015 one-ounce American Eagle gold coins, according to Bloomberg. In an email statement this week, the Mint confirmed that inventories have been depleted and no additional 2015-dated coins will be produced.  According to bullion traders, the purchase of gold jewelry for wedding season demand, along with a firm global trend, contributed to a recovery in the price of the precious metal earlier this week.  Silver bounced back a bit as well on increased offtake by industrial units and coin makers.

Gold Market Weaknesses

Precious metals funds posted their biggest outflows in almost 17 weeks, according to Bank of America Merrill Lynch, who said investors pulled out $1.0 billion in the four trading sessions to Tuesday. On the flip side, investors continue to pour money into money market funds – a net $12 billion brings the accumulated inflow to a “huge $132 billion in eight weeks,” reported BAML.

Palladium was down 2.29 percent and platinum was not far behind with a loss of 2.16 percent for the week.  Despite half the platinum mines making losses as the prices dip below $1,000, the PGM’s were the worst performing precious metals this week.

China’s net imports of gold from Hong Kong dropped for the first time in four months, according to Bloomberg. Net purchases fell to 87.8 metric tons from 96.6 in September on holiday-shortened October as well as lapsed demand in a “lean season” prior to the New Year.


Gold Market Opportunities

Mauldin Economics says there is one “universal deficiency” in most investors’ portfolios – gold. Calling the metal the “ultimate hedge against any unforeseen crisis,” the group says most professional investors agree that this asset should represent between 3 and 5 percent of a portfolio. They go on to reference Ray Dalio’s portfolio which has a 15-percent allocation to gold and similar assets in 2015, along with Marc Faber’s suggestion in August that investors allocate 10-15 percent to gold.

Precious metals bulls want to know why metals prices keep falling despite what appears to be great fundamental reasons for the contrary. A huge demand for precious metals hidden behind an enormous glut in paper supply could be why, according to Goldseek, who stated that the market has been overwhelmed by an increase in leverage. Referencing a chart in Zerohedge last week, the amount of paper gold has tripled in the past few months relative to registered stocks available for actual delivery.

BCA points out that worldwide savings rates point to continued downward pressure on interest rates. In recent years, there has been a trend of increasing investment, especially in emerging economies. However, the pattern appears to be changing, so there is an overabundance of savings as compared to investment. The shift toward lower investment rates in emerging markets may be another downtrend in real interest rates, despite the possibility of nominal interest rates increasing on December 16.   Lower real interest rates should be supportive of gold prices despite the lift in nominal rates.


Gold Market Threats

Goldman Sachs believes the U.S. could see four interest rate hikes by the Federal Reserve next year. The central bank is expected to raise the short-term Fed funds in December, and according to a Bloomberg article, Goldman predicts the U.S. will continue to grow fast enough to spur the Fed to raise rates by an average of once a quarter.

Hedge funds don’t believe that gold’s decline is over and money managers are holding their first net-short position in the precious metal since August. Talk of the U.S. raising borrowing costs for the first time since 2006 are leading investors to flee the asset class, according to Bloomberg. Assets in exchange-traded products backed by gold have reached their lowest since 2009.

Gold dropped to its lowest level since February 2010, as a looming U.S. interest rate hike in December has curbed the metal’s appeal. Fed funds rate data shows that the probability of an interest rate increase rose to 74 percent on Friday from 72 percent the day prior.

Friday, November 27, 2015

Coming of Age: China’s Yuan Joins SDR Basket As IMF Reserve Currency

Published here: http://www.zerohedge.com/news/2015-11-27/coming-age-china%E2%80%99s-yuan-joins-sdr-basket-imf-reserve-currency

Coming of Age: China’s Yuan Joins SDR Basket As IMF Reserve Currency

Christine Lagarde and the IMF Executive Board recently announced their intention to include the Chinese renminbi (RMB) in the Special Drawing Rights’ (SDR) valuation formula.  This would bring the Chinese currency into an exclusive group - alongside the US dollar, the euro, the British pound and the Japanese yen - of 5 global currencies that make up the IMF’s own reserve currency.  

So, what will this promotion really mean for the yuan?


A bank teller counts out Yuan

In market terms, not a whole lot it would seem.

The inclusion of the RMB in the SDR basket will not significantly increase demand for the currency. It is simply an acknowledgment that the Chinese currency has fulfilled two of the IMF criteria for inclusion; that it was “widely used” and that it was “freely usable”.

“The reason for there to be little effect is just that reserve currencies, SDRs, even central bank foreign exchange reserves, just aren’t all that important these days. There’ll be a little more demand for yuan than there otherwise would have been…”  Tim Worstall, Forbes

The decision is, however, a significant PR win for the Chinese leadership, both domestically and internationally, who have made their inclusion in the SDR one of their biggest fiscal priorities of the next 5 years.  As Masahiko Takeda, writing for Chinese Spectator put it:

“It is clearly a symbolic victory in China’s efforts to raise its status in the international financial community, commensurate with its growing importance in the global economy”.

It should be noted that inclusion in the SDR is very different from increasing China’s share in the IMF quota, which has also long been pending. The IMF’s quota represents the member country’s voice in the decision making at the IMF and is closely linked to the country’s influence over the IMF.

If approved, as expected, at a November 30 board meeting, it would mark the first significant change to the IMF’s “Special Drawing Rights” (SDR) basket since the inclusion of the euro at its creation in 1999.

In a statement, the People’s Bank of China thanked the IMF for the recommendation and said it was “an acknowledgment of the progress in China’s recent economic development, reform and opening up”.

Read more on the GoldCore.com blog


DAILY PRICES

Today’s Gold Prices: USD 1064.65, EUR 1005.79 and GBP 707.73 per ounce.
Yesterday’s Gold Prices: USD 1070.50, EUR 1009.41 and GBP 710.30 per ounce.
(LBMA AM)

Silver in USD - 1 Month

US markets were closed yesterday due to the Thanksgiving holiday.


IMPORTANT NEWS

Gold close to lowest in nearly six years on stronger dollar – Reuters
Gold flat as US celebrates – Proactive Investors
Indian gold demand seen falling to 8-year low in festive quarter – Reuters
Gold Trades Sideways in Asia – WSJ
Gold Heads for Sixth Weekly Decline as Fed Rate Decision Looms – Bloomberg


IMPORTANT ANALYSIS

The falls and rises in Chinese gold imports – Sharps Pixley
Chinese stocks plunge as regulators widen probe into market – The Telegraph
RBI to make gold monetisation scheme simpler to help it take off – Economic Times
As gold, platinum prices fall, investors flee precious metal funds – CNBC
The dark side of cash – MoneyWeek

Read more News & Commentary on GoldCore.com


Must-read guides to international bullion storage:

Download Essential Guide to Gold Storage in Switzerland

Download Essential Guide to Gold Storage in Singapore


Breaking News and Research Here 

Follow GoldCore on TwitterFacebookLinkedIn

Silver Prices: This Could Cause “Super Spike” in Silver Prices

Published here: http://www.profitconfidential.com/silver/silver-prices-this-could-cause-super-spike-in-silver-prices/

Here’s Why Silver Prices Could Soar in 2016
Precious metals have been amongst the worst performing investments this year. Both gold and silver prices seem to have landed in a downward spiral. The question: will silver prices rebound as we step into the New Year or just continue hitting new bottoms? In times like these, it’s always good to take advice from an expert.

For investment advice, I look no further than the respected investment maven and self-made billionaire Warren Buffett. Buffett’s investing principles are simple: invest in something that.

The post Silver Prices: This Could Cause “Super Spike” in Silver Prices appeared first on Profit Confidential.

Thursday, November 26, 2015

Yet More Rigging By Big Banks – This Time It’s Interest Rate Swaps

Published here: http://www.zerohedge.com/news/2015-11-26/yet-more-rigging-big-banks-%E2%80%93-time-it%E2%80%99s-interest-rate-swaps

Yet More Rigging By Big Banks – This Time It’s Interest Rate Swaps

The abuse of power is staggering.

Time and time again over the last number of years the largest global banks have been found complicit in the manipulation of key rates, indices and markets. Now, a large and important pension fund has taken the largest of banks to task and filed a class action lawsuit alleging conspiracy to thwart competition and extract large fees and margins from the vast and critical interest rate swap market. The banks "have been able to extract billions of dollars in monopoly rents, year after year, from the class members in this case," the suit states.

Interest rates swaps are used by companies and investors alike to manage interest rate risk. It is critical in smoothing returns and removing interest rate sensitivity. Providing an efficient trading market is lucrative, but when managers of that market collude to keep margins elevated at the cost of market participants, then we all suffer.

The lawsuit goes on to state that banks had “jointly threatened, boycotted, coerced, and otherwise eliminated any entity or practice that had the potential to bring exchange trading to buyside investors.” This policy had one purpose, "to preserve an extraordinary profit centre,” the lawsuit said. It is alleged that the banks disguised their collusion by using code names for projects such as “Lily”, “Fusion,” and our favourite, “Valkyrie,” according to the suit.

Typically, what will happen now, should the suit be successful, we will see a regulatory investigation by the authorities in the U.S. and Europe, with massive fee generation for all the professional classes concerned and associated with prosecuting, defending, and interpreting the situation.

A big fine will be handed down and paid to the regulators, (note: not the victims), by the perpetrators. No executives will be found guilty, no liability made nor conceded. Shareholders of the banks will barely take notice and the public, who have been paying the price for this collusion, will get back to the task of not giving a damn. Sure, they would be happier watching box sets.

They say people get the governments they deserve; well, they get the institutions and regulators they deserve, too. Apathy is the greatest destroyer of liberty. "Someone should do something," I hear you say, well, you are someone, so get mad.

Read the story on the GoldCore.com blog


DAILY PRICES

Today’s Gold Prices: USD 1070.50, EUR 1009.41 and GBP 710.30 per ounce.
Yesterday’s Gold Prices: USD 1072.20, EUR 1011.10 and GBP 711.23 per ounce.
(LBMA AM)

Gold in EUR - 1 Year

Gold lost $4.80 at the end of the day yesterday to close at $11.70.60. Silver gained $0.02 for the day to finish at $14.19. Platinum managed a gain, closing up $1.50 to $840.50.

IMPORTANT NEWS

Most U.S. Stocks Gain With Dollar on Strong Data as Oil Climbs – Bloomberg
Gold ends lower as U.S. data maintains rate-hike expectations – MarketWatch
Sell gold because of Draghi? That’s ridiculous – CNBC
Gold inches down, as mixed data provides few clues on rate hike timing – Investing.com
The gold that’s as light as AIR: New foam could lead to revolution in jewellery – Mail Online

IMPORTANT ANALYSIS

Will Fresh QE From ECB Boost Gold? – seekingalpha.com
‘Silk Road’ Countries’ Gold Reserves and Demand Accumulation Has Grown 450% Since 2008 – Jesse’s Café Américain
The December Jobs Number May Really Be The “Most Important Ever” – ZeroHedge
Death of paper gold & Silver: The Data Proves It – Silverseek.com
One More Lower Low? – Goldseek.com

Read News & Commentary on GoldCore.com


Must-read guides to international bullion storage:

Download Essential Guide to Gold Storage in Switzerland

Download Essential Guide to Gold Storage in Singapore


Breaking News and Research Here 

 Follow GoldCore on TwitterFacebookLinkedIn

OFFICIAL RELEASE: World Silver Deficits –12 Years Running

Published here: http://www.zerohedge.com/news/2015-11-25/official-release-world-silver-deficits-%E2%80%9312-years-running


OFFICIAL RELEASE: World Silver Deficits –12 Years Running 

Posted with permission and written by Steve St. Angelo of SRSrocco Report 

(CLICK FOR ORIGINAL)


According to the recently released Silver Institute 2015 Interim Report, the world experienced annual silver net deficits for 12 years running. This is surprising as the Silver Institute actually reported a small net surplus of silver in 2014. However, the small silver surplus turned into a deficit when 2014 mine supply and total demand figures were revised.

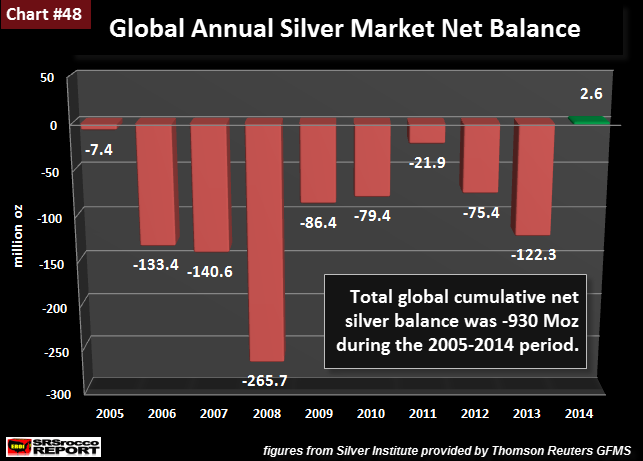
If we look at the chart below (using last year’s data), annual silver deficits were reported until 2013 and then turned into a surplus in 2014:

This was Chart #48 from THE SILVER CHART REPORT, released earlier this year. Going by this data, the world suffered a cumulative net deficit of 930 million oz (Moz) for the past decade (2005-2014). The annual net balance figure is calculated using data from Thomson Reuters GFMS provided for the Silver Institute.

The annual net balance figure is comprised by first subtracting total physical demand from total supply. This is their “Physical Surplus or Deficit figure.” They then take this physical surplus or deficit figure and add or subtract net changes in Silver ETFs and Exchange Inventories. The end result is a “Net Balance.” Basically, the annual net silver balance also takes into account the build or decline of Silver ETFs and Exchange inventories.

Even though Thomson Reuters GFMS reported a small silver surplus in 2014, I knew it was going to be revised lower to a deficit. Why? Because my analysis showed that they overestimated mine supply and underestimated physical investment demand.

For example, Thomson Reuters GFMS reported 2014 Mexican silver production of 193 million oz (Moz) at the Silver Institute, whereas my figures (taken directly from Mexico INEGI) shown in Chart #8 in THE SILVER CHART REPORT, list actual production at 184.2 Moz. Mexico INEGI’s just revised their 2014 silver production figure to 185.3 Moz.

World Suffers Consecutive Net Deficits For 12 Years Running

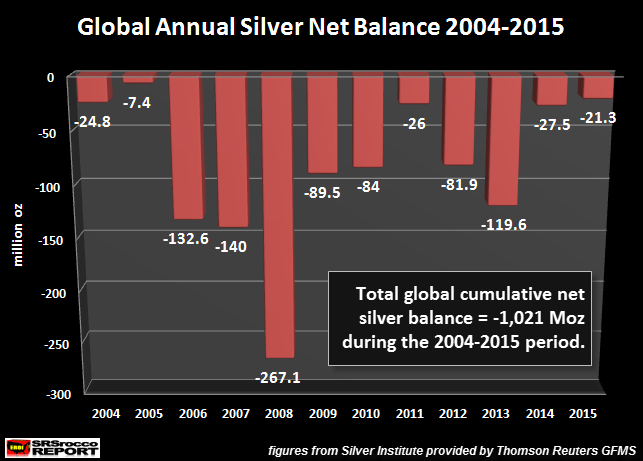
If we take the data from the Silver Institute’s 2015 Interim Report and 2014 World Silver Survey, the world experienced consecutive silver deficits for the past 12 years:

NOTE: The 2015 figure should read 2015 Est. (estimated). Actually, I believe the 2015 net deficit of 21.3 Moz will be even higher when they revise the data next year. I will get into more detail on this in following articles, but I believe estimated 2015 Silver Bar & Coin demand was under reported by a large percentage.

That being said, the 2014 small net surplus of 2.6 Moz turned into a deficit of 21.3 Moz due to global silver mine supply being revised lower by 12 Moz to 865 Moz from 877 Moz reported last year, while total Silver Bar & Coin demand was revised higher to 203.5 Moz versus 196 Moz stated last year. These two revisions accounted for the majority of the net -23.9 Moz change.

Adding up all the annual deficits from the period 2004-2015, the world suffered a cumulative shortfall of more than a billion ounces of silver… 1,021 Moz to be exact. That’s a lot of silver. So, where did it all come from and does it really matter?

When Do The Silver Fundamentals Matter?

This is the question an increasing number of precious metal investors are asking themselves. I know this first hand as this is the question I get emailed the most from my readers. Unfortunately, the fundamentals don’t provide the EXACT TIME when the fundamentals matter, but rather present data about the ongoing TREND that offers us a some important CLUES.

Here is an excerpt from the Silver Institute 2015 Interim Report on the subject of physical deficits:

The silver market is expected to be in an annual physical deficit of 42.7 Moz in 2015, marking the third consecutive year the market has realized an annual physical shortfall.While such deficits do not necessarily influence prices in the near term, multiple years of annual deficits can begin to apply upward pressure to prices in subsequent periods. This year, however, net outflows from ETF holdings and derivatives exchange inventories on a year-to-date basis have lessened the impact of the physical deficit, bringing the net balance to ?21.3 Moz.

Remember, the estimated physical silver deficit of 42.7 Moz in 2015 does not factor in the net change of Silver ETFs and Exchange Inventories… which was a net decline of 21.4 Moz (as of Sept 2015).

Regardless, the important item to focus on in the quote above is the statement, “multiple years of annual deficits can begin to apply upward pressure to prices in subsequent periods.” What is interesting here (not discussed in the Interim Report) is that net silver deficits have been now going on for 12 consecutive years when we also include builds in Silver ETFs and Exchange Inventories.

We must remember, the large build in Global Silver ETF inventories (2006-2010) had to come from physical silver supplied by the market. According to the Silver Institute, the total cumulative build in Global Silver ETFs was 569 Moz for the five-year period….. 2006-2010.

So, where did all this silver come from to supply a 1+ billion oz shortfall over the past 12 years? That is the trillion dollar question. I believe this billion oz shortfall was supplemented from a source known as “Unreported Above-ground Stocks.” While this figure is nothing more than a good guess by various official sources, it has fallen precipitously since the 1990’s.

The CPM Group stated that “Implied Unreported Silver Stocks” reached a peak of 2.2 billion oz (approximate figure) in 1990 and fell to less than 200 Moz in 2014. This draw-down of unreported above-ground stocks supplemented both the annual physical supply deficits and builds in Global Silver ETFs over the past 35 years.

While it’s impossible to know how much remaining silver (from unreported above-ground stocks) can be used to supplement ongoing annual deficits going forward, there’s probably a lot less than we realize. Furthermore, the segment of the silver investment market that was impacted the most during the rapid 60% fall in the silver price was Global Silver ETFs.

As I stated above, from 2006-2010, the net build of Global Silver ETFs were 569 Moz. However, from 2011-2015, the net increase in Global Silver ETFs were a paltry 18.2 Moz. What happened if the price of silver continued to rise 2012-2015? Main Stream investors would have piled into the Silver ETFs pushing up their total global inventories. Rising Global Silver ETF inventories on top of rising physical Silver Bar & Coin demand would have put a real strain on remaining “Unreported Above-Ground Stocks.”

Even though precious metal sentiment is now probably at all time lows, investors need to realize NOTHING HAS BEEN FIXED in the Global Financial Markets. Yes, it’s true that the propping up of the markets by the Fed and Central Banks has gone on longer than we realized, the unraveling of the World’s Greatest Financial Ponzi Scheme is still on its way.


Please email with any questions about this interview, precious metals, or to receive these in your inbox HERE.


Wednesday, November 25, 2015

Gold Market Goes Quiet - Do We Hear The Echo Of The Bottom?

Published here: http://www.zerohedge.com/news/2015-11-25/gold-market-goes-quiet-do-we-hear-echo-bottom

Gold Market Goes Quiet - Do We Hear The Echo Of The Bottom?

Demand for gold is soaring according to the World Gold council’s latest report. The report shows that overall worldwide demand for gold rose by a very significant 33% with the US, Europe, China and Russia all stocking up and pushing demand. Central bankers, lead by Russia, are stocking up aggressively.

With fundamentals like these, why are gold prices not soaring? Crowd psychology might be one reason. Sol Palha of Technical Investor explains.

Year-on-Year Changes in Gold Demand, By Category (Source: WGC)


“Fundamentals do not drive the market; they just provide you with a picture to somewhat justify your biased views. What drives the market is emotions, and some technical indicators have the ability to pick up on these emotional changes. Crowd psychology is probably one of the best and least utilized tools when it comes to spotting topping and bottoming action”.

“From the Technical analysis perspective, gold has one more leg down, but the last leg might or might not be too steep. It will serve to bolster the foolish notion that the Gold bull is dead. Every bull market undergoes a back-breaking correction, and Gold is no exception. We believe the next leg up will yield even larger profits”.

Technical Investor“To indicate that a bottom is in place, Gold cannot close below 1050 on a weekly basis; failure to hold above this level should lead to a test of the 1000 ranges, with a possible overshoot to $950”.

“From the mass psychology perspective, Gold is very close to putting in a bottom. Sentiment investors, contrarian investors and investors who are familiar with the concept of mass psychology should consider taking a closer look at the precious metal’s sector now”.

Read of Palha’s analysis: “Is Gold on the verge of a breakout?

Read more on the GoldCore.com blog


Other sources:

- Gold Bullion Demand Surges 27% In Q3 – New Chinese “Buying Spree"

- The Gold Bull is Dead - Tactical Investor


DAILY PRICES

Today’s Gold Prices: USD 1072.20, EUR 1011.10 and GBP 711.23 per ounce.
Yesterday’s Gold Prices: USD 1073.00, EUR 1008.32 and GBP 709.67 per ounce.
(LBMA AM)

Gold in EUR - 1 Month

Gold managed a gain yesterday rising $6.70 to close the day at $1075.40. Silver gained a marginal $0.06 to close at $14.17. Platinum lost $4 to $839.

IMPORTANT NEWS

Gold rises 1 percent on softer dollar, Turkey-Russia tensions – Reuters
Gold Ends Higher As Middle East Tensions Spur Haven Demand – WSJ
Gold extends gains on geopolitical tensions but US rate view drags – Reuters
Asia Stocks Slip as Syria Angst Buoys Gold; Ringgit Jumps on Oil – Bloomberg
Wall Street ends higher on energy lift – Reuters

IMPORTANT ANALYSIS

The case for why gold may finally be nearing a bottom – MarketWatch
How Roman Coins Found Buried in Swiss Orchard Reinforce Gold Ownership Today – Market Oracle
Is Gold on the verge of a breakout? – GoldSeek.com
The Success of Irish Economic Austerity: The Joke is on Krugman – Market Oracle
US Mint has no “sufficient to meet public demand” requirement – 24hgold.com

Read more News & Commentary on GoldCore.com


Must-read guides to international bullion storage:


Download Essential Guide to Gold Storage in Switzerland


Download Essential Guide to Gold Storage in Singapore

Breaking News and Research Here 

Follow GoldCore on TwitterFacebookLinkedIn

This Is China's Middle Finger For The Global Economy

Published here: http://www.zerohedge.com/news/2015-11-25/chinas-middle-finger-global-economy

A few months ago, we already alerted you in a previous column about some interesting remarks, made by Christine Lagarde, the head of the International Monetary Fund. Lagarde said that ‘if there’s any growth amongst the emerging countries/economies, it will come from India’. Since this statement, the Central bank of China has cut the interest rates even further.

China interest rate

Source: tradingeconomics.com

That was a remarkable statement and initially we thought this was just a strategy to draw the attention away from the Chinese stock market which was extremely volatile during the summer months, but now the Chinese President, Xi Jinping, told the attendees of the G20 meeting in Turkey that ‘the world needs to find new sources of economic growth’, and that’s a very remarkable statement from a government leader that has continuously said there’s no problem at all in China nor with the Chinese economy.

Xi Jen

Source: Huffingtonpost.com

The statement isn’t a real surprise as the Chinese economy grew by just 6.9% YoY, which seems to be the lowest growth rate in a few decades. And that could be worrisome. Of course, at a pace of 6.9 (or 7)% per year, the Chinese economy is still fairly robust and it will continue to grow. However, Jinping’s recent statement might indicate China is unsure whether or not it will effectively achieve the 7% growth rate in the current financial year and the country might already be preparing the world for a sub-7% economic growth from next year on.

Shanghai 1

Source: stockcharts.com

The financial markets in China didn’t seem to care too much about the statement, but we’re afraid the 200 day moving average (the red line on the chart) might be a very difficult hurdle to take in the coming weeks.

China Growth Rate

Source: tradingeconomics.com

Every modern first world country would be ecstatic with even just half of that growth rate, but a slowing Chinese economy would send shivers down a lot of spines. Why? Because there is no alternative, and the entire world seemed to have been relying on the double-digit growth numbers.

Truth be told, the entire world was looking at China to ensure continuous economic growth. Keep in mind it was the Chinese economy that pulled the world out of the global financial crisis in 2008. It was the Chinese economy which boosted the early stage economic recovery of the first world countries. And now, seven years after the GFC, China’s slowdown might have larger repercussions than originally anticipated as there simply is no plan B.

Where will the world’s economic growth come from? Europe? Give us a break. Canada or Russia? Not with the current oil and gas prices. The USA? Not if Yellen increases the interest rates in December. And yes, the general consensus seems to have evolved towards a rate hike in December, but we remain convinced the American economy remains too weak to fully digest it. Keep in mind ECB president Mario Draghi has announced he is prepared to do whatever is necessary to increase the inflation rate and has hinted at further interest rate cuts (even though the deposit rate is already negative) and purchasing more bonds to increase the liquidity in the system.

A slowing Chinese economy and a looming rate hike in the USA whilst the European counterparty will be cutting the benchmark interest rate does not make sense at all right now as the only thing the Federal Reserve will accomplish, is to hit its own economy due to the lower demand for American products due to a deteriorating economic situation and an expensive dollar.

China’s statement that ‘growth will have to be found elsewhere’ indicates a rate hike by the Federal Reserve could be a really, really bad idea.

>>> Time to protect yourself & read our Guide to Gold FOR FREE

Secular Investor offers a fresh look at investing. We analyze long lasting cycles, coupled with a collection of strategic investments and concrete tips for different types of assets. The methods and strategies are transformed into the Gold & Silver Report and the Commodity Report.

Follow us on Facebook @SecularInvestor [NEW] and Twitter @SecularInvest

Have Silver Stocks Finally Hit Rock-Bottom? Maybe

Published here: http://www.profitconfidential.com/silver/have-silver-stocks-finally-hit-rock-bottom-maybe/

Where Are Silver Prices Going Next? Extreme Pessimism Prevails
Are silver stocks about to bottom? This is the question that’s on every precious metal investor’s mind these days.

With my job, I am fortunate enough to go to precious metal and mining conferences around North America. This week, I am at Silver Summit, organized by Cambridge House International and Katusa Research. This is the first time I’m attending this conference in San Francisco, but it has been going on for several years.

I go to conferences like these to see the sentiment of investors, companies,.

The post Have Silver Stocks Finally Hit Rock-Bottom? Maybe appeared first on Profit Confidential.

Ask The Expert - Steve St. Angelo!

Published here: http://www.zerohedge.com/news/2015-11-24/ask-expert-steve-st-angelo


Ask The Expert - Steve St. Angelo

(Click for Original Post)


Steve St. Angelo is an Independent researcher who started to invest in precious metals in 2002. Later on in 2008, he began researching areas of the gold and silver market that, curiously, the majority of the precious metal analyst community have left unexplored. These areas include how energy and the falling EROI – Energy Returned On Invested – stand to impact the mining industry, precious metals, paper assets, and the overall economy. His work can be seen on numerous online publications, but his website, SRSrocco Report, is highly regarded as one of the most invaluable publications of its kind in the sphere of precious metals and the economy.


Please email with any questions about this interview, precious metals, or to receive these in your inbox HERE.


Silver Prices: Indicator Suggests Silver Prices Could Soar 420%

Published here: http://www.profitconfidential.com/silver/silver-prices-indicator-suggests-silver-prices-could-soar-420-percent/

Silver Prices Could Be Poised to Skyrocket
Although silver prices have been down in the dumps lately, there are some positive signs for the silver bugs. Anyone interested in silver investing should pay attention to this incredible indicator that’s predicted huge gains for silver prices in the past.

By “huge,” I mean increases of up to 420%, which is the kind of profit investing dreams are made of. But the last few years have been terrible for silver investing, with silver prices falling from $50.00 in 2011 to its current level of $14.17..

The post Silver Prices: Indicator Suggests Silver Prices Could Soar 420% appeared first on Profit Confidential.

Tuesday, November 24, 2015

Trouble Is Brewing in the Paper Markets for Gold and Silver

Published here: http://goldsilverworlds.com/gold-silver-experts/trouble-is-brewing-in-the-paper-markets-for-gold-and-silver/

By Clint Siegner, Money Metals Exchange

Precious metals bulls question why metals prices keep falling in the face of what appears to be strong demand and great fundamental reasons for prices to move higher instead.

The bears have some answers of course. You can’t eat gold, it’s basically a pet rock, and modern financial systems are doing just fine without anything as antiquated as bullion gumming up the works.

The bears are declaring victory and saying the market has spoken. They ought to look a bit deeper into recent developments.

Outside of the price action, there is very little to support claims that gold and silver are relics of the past.

trouble-brewing-gold-silver-quoteLately, the real answer to the bulls’ question about why prices are headed lower isn’t the stuff of a lengthy philosophical debate. These days, the answer seems to be a lot simpler; huge demand for physical metal hidden behind an enormous glut in paper supply. And the actual physical metals are shifting into new hands.

Without looking, you would never know that exchange inventories are falling – a combination of demand for physical bars and a dearth of sellers willing to furnish actual metals at the current price.

The natural dynamic is for prices to move higher, but the market has been completely overwhelmed by a huge increase in leverage. Unfortunately, there is no end to the supply of paper gold and silver contracts the trading exchanges will stack atop a shrinking layer of physical bars in their vaults.

The amount of paper gold has tripled relative to “registered” stocks available for actual delivery. This has happened in just the past few months. Just one ounce of registered gold now backs nearly 300 ounces in COMEX contracts (as depicted in a chart we re-published last week from Zerohedge.com).

Stated another way, that’s razor thin coverage of just 0.0033. Trouble is brewing. About 1% of contract holders have been standing for delivery in recent years. So we could see requests to deliver 3 times more gold than is currently in the registered category in Exchange vaults.

trouble-brewing-gold-silver-comexchart

To avoid default, the exchanges are going to need more registered gold. Luckily, there is another category of physical inventory available to draw against.

The vaults also hold “eligible” gold which can easily be converted to registered, provided the owners are willing. Bullion banks often move bars from the “eligible” category to “registered.” In fact, that is what they have been doing recently.

The problem is stocks of eligible gold are collapsing as well. TFMetalsReport.com reports that combined eligible and registered gold in the COMEX have fallen nearly 50% during the past 5 years.

It’s a lot worse for JPMorgan Chase and Scotia Mocatta, two of the largest bullion banks. Since March the amount of eligible and registered gold in their vaults has fallen from 3,732,915 ounces to 1,515,825 ounces. That’s a 59% drop in just the past few months. And December is historically the biggest month of the year when it comes to requests for physical delivery.

The drop in physical inventory isn’t limited to COMEX vaults. Trouble is brewing in London’s LBMA market – the world’s largest exchange – as well. Ronan Manly authored a report estimating that LBMA stocks outside the Bank of England vaults have fallen by 67% since 2011.

trouble-brewing-gold-silver-lbmachartHowever, the report estimates that ETFs hold 1,116 of the 1,122 tonnes remaining, leaving only 6 tonnes – roughly 200,000 ounces – really in play for delivery.

Consider that LBMA banks often trade 1,000 times that amount – 200,000,000 ounces – in paper gold per day, and you find the same completely untenable scenario.

The price is falling because exchanges around the world are happy to let traders and banks sell more and more metal they don’t have and almost certainly can’t get. On the other side are folks busily buying the paper gold and ignoring the metastasizing counterparty risk. And behind-the-scenes inventories are vanishing as players with greater concern take delivery of bars and head for the exit.

There is no telling how this scenario will end. It could end if spot prices rise to the point that sellers with actual bars show up to sell. Or we may see exchanges engulfed and destroyed by a massive wave of delivery defaults. Who knows?

However, given the explosion in leverage over the past few months, the question of when it will end may be easier to answer. The reckoning for metals markets may not be far ahead.

clint-siegnerClint Siegner is a Director at Money Metals Exchange, the national precious metals company named 2015 “Dealer of the Year” in the United States by an independent global ratings group. A graduate of Linfield College in Oregon, Siegner puts his experience in business management along with his passion for personal liberty, limited government, and honest money into the development of Money Metals’ brand and reach. This includes writing extensively on the bullion markets and their intersection with policy and world affairs.

Global Bond Markets: Where Did All the Liquidity Go?

Published here: http://www.zerohedge.com/news/2015-11-24/global-bond-markets-where-did-all-liquidity-go

Why does the lack of liquidity in bond markets have many of the world's top economic opinion-makers worried?  Ben Wright writing in the Telegraph reports on the voices in "the chorus of doom" and explains why the evaporation of this liquidity in the global fixed income market signals "a warning shot across the bow".

GoldCore: Where has all the liquidity gone?
Where did all the liquidity go? Photo: Ryan Brennecke

"Every market is a tug-of-war between buyers and sellers. Liquidity is a gauge of both the size of the market (the number of buyers and sellers) and its depth (the number of buyers and sellers of both small and large amounts of securities). Why is the depth of the market important? Because you’re sure to find plenty of willing buyers if you want to sell £10,000 of government bonds. But if you want to sell £100m-worth, it might be a touch harder."

"The less liquidity there is, the greater the impact large trades will have. If lots of people are all trying to sell lots of stuff at once, it could get messy."

GolfCore: Where has all the liquidity gone?"Since the financial crisis, global financial regulators have rightly been attempting to make banks safer. They have done this by, for example, banning proprietary trading, making it harder to lend government bonds in the repo market and, most importantly, forcing banks to deleverage.  One of the upshots is that it is now much more expensive for banks to hold securities on their own books and therefore provide liquidity in the market. Deutsche Bank recently noted that the amount of outstanding corporate bonds has doubled since 2001 but dealer inventories of these securities have fallen 90pc over the same period".

Read the full article "The world's multi-trillion dollar bond market is circling the drain" in the Telegraph.

Ben Wright is Group Business Editor at The Telegraph. He was previously the City Correspondent at The Wall Street Journal and before that Editor of Financial News.  Follow him on Twitter.


Read also:
"As more investors pile into overvalued, increasingly illiquid assets – such as bonds – the risk of a long-term crash increases.  This is the paradoxical result of the policy response to the financial crisis. Macro liquidity is feeding booms and bubbles; but market illiquidity will eventually trigger a bust and collapse."
Nouriel Roubini in "The Liquidity Time Bomb"

DAILY PRICES
Today’s Gold Prices: USD 1073.00, EUR 1008.32 and GBP 709.67 per ounce.
Yesterday’s Gold Prices: USD 1068.35, EUR 1005.90 and GBP 705.31 per ounce.
(LBMA AM)

GoldCore: Gold in USD - 1 Year

Gold in USD - 1 Year

Gold fell again yesterday, losing $8.50 to close the day at $1068.70.  Silver lost $0.04 closing at $14.11. Platinum lost $6 to $843.

IMPORTANT NEWS

Gold, silver, platinum at multi-year lows on robust dollar, Fed view – Reuters
Gold Falls on Stronger Dollar, Negative Sentiment – WSJ
Gold posts lowest close since February 2010 – MarketWatch
Gold drops towards 6-year low on dollar, US rate hike view – Reuters
Richard Russell, Publisher of Dow Theory Letters, Dies at 91 – Bloomberg


IMPORTANT ANALYSIS

Gold Prices Hit Six-Year Lows: Should You Buy? – NDTV Profit
Another Look at the Gold Price Drop of 6 November – ZeroHedge
Six big risks facing global markets in 2016 – The Telegraph
The scandal isn’t what’s illegal — it’s what’s perfectly legal – Goldseek.com
Silver Prices and The Management of Perception – Silverseek.com

Read more News & Commentary on GoldCore.com

Download the Essential Guide to Storing Gold in Switzerland

GoldCore: The Essential Guide to Storing Gold in Switzerland

Download the Essential Guide to Storing Gold in Singapore

GoldCore: Storing Gold in Singapore

Fractional-Reserve Banking is Pure Fraud, Part I

Published here: http://www.zerohedge.com/news/2015-11-23/fractional-reserve-banking-pure-fraud-part-i


Hold your real assets outside of the system in a private, non-government regulated, international facility   -->  http://www.321gold.com/info/053015_sprott.html


Fractional-Reserve Banking is Pure Fraud, Part I 

Written by Jeff Nielson (CLICK FOR ORIGINAL)


This is a commentary which should never have needed to be written. What is euphemistically called “fractional-reserve banking” is obvious fraud, and obvious crime. By its very definition, it transforms the banking sector of an economy into a leveraged Ponzi-scheme, and as with all Ponzi-schemes, there is no possible “happy ending” here.

Mathematically-based principles are often illustrated best through use of an extreme, numerical example. We have no need to construct any hypothetical extremes, however, when we already have real-life insanity, in our current monetary/regulatory framework.

Here it is important to note that in order to conceal the fraud, crime, and insanity of our present system to the greatest degree possible, the bankers hide their dirty deeds within their own convoluted jargon. Thus presenting “fractional-reserve banking” to readers requires some brief investment of time in definition of terms, starting with this term, itself.

Fractional-reserve banking evolved literally based upon the temptation of all bankers to perpetrate fraud. Empirically it has always been observed, down through the centuries, that under normal circumstances, only a tiny percentage of depositors will come to claim their cash/wealth at any one time. Thus the temptation is for bankers to “lend” more funds than they actually possess, i.e. they are “lending” what does not even exist: “fractional-reserve banking” – the ultimate euphemism of banking and fraud.

It goes without saying that anyone or any entity which endeavours to “lend” something which does not exist is perpetrating fraud. But before examining this inherent fraud more closely, it is important to back-up, and look at the Law. Note that even when banks “lend” the money which they actually do hold on deposit (as trustees for the depositors) that this is already wholly/totally illegal. It is the crime known as“conversion”.

Criminal conversion:

A person who knowingly or intentionally exerts unauthorized control over property of another person commits criminal conversion.

When your bank lends-out money you deposited, which it claims to be “holding” for you as trustee, does it seek your prior authorization before lending-out your property and thus putting it at risk? Of course not. The banks get around the naked criminality of their lending operations through general authorization. In the small-print of any/all bank deposit contracts is a clause whereby the depositor “authorizes” the bank to lend-out their property to Third Parties.

We therefore start with the basic fact, that “banking” as we know it (bankers taking deposits, and then lending those deposits) is literally institutionalized crime. But “fractional-reserve banking” goes far beyond this original level of criminality.

Not only are banks allowed to lend what they don’t own, they are allowed to lend what they don’t even possess – and by many multiples. “Banking” is institutionalized crime. “Fractional-reserve banking” piles-on a systemic and enormous element of fraud: “lending” what does not even exist. But this isn’t even the most-shocking aspect of fractional-reserve fraud.

Here readers need to understand the consequence of allowing banks to lend what they do not even possess. A simple, hypothetical example will illustrate the principal-of-insanity which is the basis of our current monetary system .

Suppose JPMorgan holds $1 billion in total deposits. In the original form of our fractional-reserve fraud, the fraud ratio was set at 10:1. This meant that for every dollar which a bank actually held, it was allowed to “lend” $10. Now the simple arithmetic.

JPMorgan is holding $1 billion of other peoples’ property, but it is allowed to “lend” a total of $10 billion. Where does the other $9 billion come from? It is literally conjured out of thin air , via fractional-reserve fraud. Thus, for many readers, this represents their first, actual glimpse of the full fraud, and full insanity of our current monetary system.

In the original form of our “fractional-reserve” monetary system, for every $1 which our central banks officially printed, the banking system created an additional $9 out of thin air, via fractional-reserve fraud. Simply put, 90% of all the actual “money” in our monetary system, and our economies, was conjured out of thin air , by private banks, via fractional-reserve fraud.

This is fractional-reserve banking, presented as the naked fraud that it is: bankers “lending” not only more than what they possess, but lending out “money” which grossly exceeds the amount of capital in existence. Conjuring oceans of paper out of thin air. It is inherently criminal. It is inherently fraudulent.

It automatically transforms our monetary system into an institutionalized Ponzi-scheme. By definition, all “fractional-reserve banking systems” must automatically collapse – in a sea of fraud – if all depositors simply claim a tiny portion of their deposits, at any one time.

This is also known euphemistically as a “run on a bank”. Here, however, the euphemism is intended to insinuate that the mere act of depositors taking possession of their own property is somehow a “crime” against that financial system. Indeed, directly implying as much, our own governments will institute “bank holidays”. This is yet another banking euphemism where depositors are legally prohibited from taking possession of their own property. The most recent example of such financial oppression was in Greece .

How can governments justify such financial oppression? While it is never explicitly acknowledged, the justification is entirely singular: to prop-up a Ponzi-scheme. It thus becomes necessary for governments to abandon the Rule of Law, and legally prevent/prohibit their own citizens from taking possession of their own property – as the only means of preventing the complete implosion of that system. The epitome of a Ponzi-scheme.

Observe how totally perverted and totally criminalized is the current system of fractional-reserve fraud. The banks are legally allowed to commit the crime of conversion: “lending” what they do not own. The banksare legally allowed to commit fraud: “lending” what does not even exist. But if/when Depositors seek to take possession of their own property, they are treated like criminals.

The bankers are granted absolute legal protection to perpetrate their fraud/crime, at the direct expense of the law-abiding citizens of that society.

However, this marks only the starting-point for our present system of monetary/financial fraud . In its original form, fractional-reserve fraud was already entirely criminalized, and already entirely fraudulent. How/why would our governments have ever turned our entire financial system into such institutionalized fraud?

They were convinced to do so on the basis of the promise/guarantee of the bankers. The bankers promised that they would exercise the enormous, legal privilege which they had been granted by acting in a responsible manner, and doing nothing to jeopardize this institutionalized Ponzi-scheme.

In reality, the banks have done the precisely the opposite. First the Big Bank crime syndicate had their servants in our puppet-governments tear-up the legal distinction between “banking” (institutionalized fraud) and “investing” ( institutionalized gambling ). Overnight, our banks were transformed into bank-casinos.

Not only were these “banks” lending-out funds which grossly exceeded their current assets, they were gambling with these funds, and at even greater ratios of leveraged fraud. The result of combining extreme fraud with extreme financial recklessness was the Crash of ’08. The Big Banks literally “blew up” the Western financial system with their extreme, reckless gambling – gambling which began with the deposits which they claimed to be holding as trustees.

Instead of our governments punishing these Big Banks for their extreme, reckless fraud, they rewarded them. Using our money, these Traitor Governments indemnified the Big Banks for every cent of their reckless, fraudulent gambling. Then they did something much, much worse.

Our Traitor Governments bowed to the will of their banker Overlords, and dubbed these institutions of fraud/crime as being “too big to fail” . Translation? Instead of preventing these institutions of financial crime from continuing their reckless gambling, they promised to pay-off all of the banksters’ gambling debts, forever.

What happens when you tell any Compulsive Gambler that you will make-good on all of their gambling losses? The Gambler runs wild. Observe what the banking crime syndicate calls “the derivatives market” . It is their own private, rigged casino, where the total amount of ultra-leveraged betting is twenty times as large as the entire global economy .

Thus to go with the institutionalized crime and the institutionalized fraud of “fractional-reserve banking”, our Traitor Governments then added institutionalized extortion : allowing the Big Bank crime syndicate to blackmail our governments, in perpetuity, with the threat “bail-out all of our bad debts, or else…”

Following the Crash of ’08, and the literal sell-out by our own governments to the Big Bank crime syndicate, all of these Traitor Governments made the same promise to us: “never again.” Supposedly, they would never again allow the Big Banks to blow-up our financial system, and to keep this promise, they all pledged “tough, new laws” – to restrain the reckless gambling of the Big Bank crime syndicate.

What these Traitor Governments actually did was the exact opposite of everything they promised. Instead of reducing and restraining the insane, reckless gambling of the bankers which led to the Crash of ’08, they institutionalized that, as well.


This will be the subject of Part II: taking a system which was already wholly criminal, ridiculously fraudulent, and completely unstable, and making it much, much worse.


Please email with any questions about this article or precious metals HERE


Monday, November 23, 2015

Soaring Global Debt – The Reality Check in Numbers

Published here: http://www.zerohedge.com/news/2015-11-23/soaring-global-debt-%E2%80%93-reality-check-numbers

Soaring Global Debt: The Reality Check in Numbers

The fact that global debt is growing throughout the world is widely acknowledged and well documented. However, when faced with the numbers, the magnitude of the problem is still quite shocking to read. An article last week in Washington's blog gives us a stark and timely reminder of those facts. The volatile geo-political environment we are entering into, coupled with this growth-stifling debt, makes for a dangerous economic combination.

[Source: Forbes Business/Statista]


“The debt to GDP ratio for the entire world is 286%. In other words, global debt is almost 3 times the size of the world economy. Both public and private debt are exploding and - despite what mainstream economists think - 141 years of history shows that excessive private debt can cause depressions”.

These global debt figures cannot be ignored. Indeed, many erudite economic commentators have been highlighting the reckless monetary policies being pursued by governments around the world that is feeding our debt crisis.

“The underlying cause of this debt glut is the $12 trillion of free or cheap money created by central banks since 2009, combined with near-zero interest rates. When the real price of money is close to zero, people borrow and worry about the consequences later.” Paul Mason (See: “Apocalypse Now: Has Next Giant Financial Crash Already Begun?”)

Similiarly, Jeremy Warner's recent warnings about our imminent slide into fiscal crisis in “Europe is sliding towards the abyss, and the terrorists know it” reminds us of the vast expense of going to war. A decision that has very long-term repercussions economically and is a situation over which it would appear we have little or no control over, if the threat of terrorism is to be contained.

“Indeed, not only does war lead to debt, but high levels of debt lead to more war.”

Read more on the GoldCore.com blog


Download your guide to Protecting Your Savings in the Coming Bail-in Era


DAILY PRICES

Today’s Gold Prices: USD 1068.35, EUR 1005.90 and GBP 705.31 per ounce.
Friday’s Gold Prices: USD 1085.15 , EUR 1014.80 and GBP 709.26 per ounce.
(LBMA AM)


Gold in USD - 5 Years

Gold closed down $4.80 on Friday to $1077.20 – a loss of 0.44% for the week. Silver was down $0.12 to $14.15, a loss of 0.56% for the week. Platinum lost $4 to $849.

IMPORTANT NEWS

Gold extends losses on US rate hike view, stronger dollar – Reuters
Gold ends lower, logs fifth weekly loss in a row – MarketWatch
Copper Slumps Below $4,500, Nickel Plunges 5% as Metals Slide – Bloomberg
Gold Drops on Outlook for Rates as Silver Slumps to Six-Year Low – Bloomberg
Hedge Funds Are Back to Bearish on Gold as Price Slump Deepens – Bloomberg

IMPORTANT ANALYSIS

The Economic Impact of Evil – Goldseek
“It’s All A Lie” – Eric Sprott Slams Massive Monetary Metals Manipulation – ZeroHedge.com
Paris attacks: global stock markets braced for sell-off – The Telegraph
An Essay Considering the Current Monetary Orthodoxy and Gold – 24hgold.com
SHANGHAI vs COMEX: Opposite Moves In Silver Inventories – Silverseek.com

Read more News & Commentary on GoldCore.com


Breaking News and Research Here 

Follow GoldCore on TwitterFacebookLinkedIn

The Rats and The Sinking Ship

Published here: http://www.zerohedge.com/news/2015-11-23/rats-and-sinking-ship


The Rats and The Sinking Ship

Posted with permission and written by Turd Furguson of TF Metals Report (CLICK FOR ORIGINAL)


Yes, what we are about to show you is simply a collection of anecdotal data points. Taken separately, perhaps they can all be written off and marginalized. Taken collectively, however...well, maybe there's something to consider here.

This site has been around for over five years now and, for most of that time, we've preached about how fractional reserve bullion banking is a scheme that is destined to fail. By pricing a physical commodity upon the oversupply of paper derivatives, shortages become inevitable. The market recognizes the value of the mispricing and drives up demand. At the same time, the lower price affects supply as producers of the commodity limit or shut down production due to the economics and declining/negative margins.

What eventually happens is a physical supply shortage that manifests itself in smaller global stockpiles. This is evident in the increasing abundance of stories about the tight global gold market, particularly in London. This has also become apparent in silver as, just this week, Thomson Reuters GFMS released their latest Silver Interim Report, which projected the third consecutive year of a global shortfall in the supply of physical silver. Check these links for details:

As we all know, the global "price" of physical gold and silver is largely derived by trading on highly-leveraged futures exchanges such as The Comex in New York. On these exchanges, a modern form of alchemy has been perfected, whereby a relatively small amount of metal can be leveraged multiple times in the creation of paper metal derivative contracts. If after five years we are, in fact, seeing the first realphysical cracks in the global paper metal bullion banking scheme, logic would compel us to expect those cracks to appear at The Comex first.

And that may be what we are seeing play out in real time. Below are those "anecdotal data points" mentioned above. Consider them independently but also take time to view them collectively, as well.

COMEX BANK LEVERAGE AT RECORD LEVELS

This site and others have been documenting this trend for weeks. What we're talking about here is notmargin leverage. Instead, this is The Banks' ability to lever their existing supply of readily-deliverable gold. On the Comex, this is gold classified as "registered" and it is this registered stockpile that has been at record lows for over two months. As of Thursday, the amount of gold shown in this category was just 151,384 troy ounces. When you divide this amount of available gold into the total amount of "paper gold" outstanding...as measured by a total open interest of 424,000 contracts (100 paper ounces per contract)...we get a historically high and unprecedented leverage ratio that is nearing 300:1. We've repeatedly written about this here and you can also see this displayed on the chart below from ZeroHedge:http://www.tfmetalsreport.com/blog/7249/bullion-bank-leverage-soars-near-3001

TOTAL COMEX GOLD STOCKS

However, it's not just registered gold on The Comex that is dwindling, it's also the total amount of gold held in the bullion bank vaults. The chart below was published yesterday by Dave Kranzler, at his excellent site called Investment Research Dynamics:http://investmentresearchdynamics.com/did-greshams-law-invade-jp-morgans-comex-gold-vault/ Note that over the past five years the total amount of gold held within the Comex vaulting system has declined from over 12,000,000 troy ounces to yesterday's new low of 6,436,404 troy ounces. Of course, this hasn't limited The Banks ability to create paper metal to meet occasional speculator demand, but that's a topic for another day. http://www.tfmetalsreport.com/blog/7214/inherent-unfairness-comex

THE GOLD HELD BY JP MORGAN

But let's dig even deeper and look at the gold held by individual Bullion Banks within the Comex vaulting system. Every day, the CME puts out a "Gold Stocks Report" which attempts to show the total amount of gold held within the Comex vaults, though the CME added a major disclaimer to the report back in 2013 (http://jessescrossroadscafe.blogspot.com/2013/06/caveat-emptor-another-level-of-risk.html)

On the Gold Stocks report below, dated July 27 of this year, note that JPM reported a total vault of nearly 1,398,215 ounces. In that vault were 115,755 ounces categorized as registered and 1,282,460 ounces listed as eligible.

Next is a chart from about two weeks ago. Note that JPM's total vault has been more than cut in half. Total registered gold has fallen to just 10,777 ounces and total eligible gold was shown to only be 657,721 ounces. Hmmm.

But now look at what has transpired in just the past week. The total amount of gold held in the vaults of JPM has been cut in half again! As of Monday, JPM showed a total of 668,498 ounces of gold in their Comex vault. After two separate withdrawals of nearly five metric tonnes, JPM's vault was down to just 347,898 ounces as of yesterday:

So, after including the massive withdrawals of just this week, the total amount of gold held by JPMorgan in their Comex vault has fallen by 1,050,317 troy ounces...or 32.7 metric tonnes...that's a cumulative 75.1%...in just the past four months.

SCOTIA MOCATTA'S GOLD AND SILVER VAULTS

And if you're beginning to feel as I do...that all of these points are connected...then what is going on at The Scoshe might be the most important as the Canadian bank, Scotia Mocatta, is the "oldest" gold dealer and bullion bank in the world.

One might think that, as the world's oldest bullion bank, The Scoshe is pretty well wired into what's going on in the global gold market. Additionally, you don't get to be the longest-tenured bullion bank without recognizing/anticipating change and then positioning yourself for future profits...and, as importantly, avoiding current losses.

We've detailed what appears to be a slow-burning "bank run" that is ongoing at Scotia Mocatta's Comex vault. We most recently wrote about the trend here: http://www.tfmetalsreport.com/blog/7170/comex-bank-run-scotia-mocatta Note that The Scoshe (or their clients) almost appears to be exiting the Comex system...similar to what we're now seeing at JPMorgan. As you can see on the report below, back on March 5 of this year The Scoshe allegedly held 3,066,169 troy ounces of gold in their Comex vault. (You might also note the total amount of gold held by all six banks at that time and compare it to the 6,436,404 ounces reported yesterday.)

Now let's look again at the CME Gold Stocks report from yesterday. Notice that The Scoshe currently shows just 79,096 ounces of registered gold and about 1,008,831 ounces of eligible gold for a total vault of 1,167,927 troy ounces. This means that, over the course of the past 8+ months, Scotia Mocatta has lost 77% of its registered gold and 60% of its eligible gold. As measured by its total vault, the drop has been 1,898,242 troy ounces...or 59.4 metric tonnes...that's a cumulative 61.9%...in a little over eight months.

And here's where the intrigue regarding The Scoshe gets even deeper. They're losing (moving?) silver, too.

Below is a CME Silver Stocks report from September of 2013. Note that the total amount of silver held with Scotia Mocatta's Comex vault was well over 22MM ounces or about 695 metric tonnes.

By May of this year, Scotia's silver vault was down to about 15MM ounces or about 468 metric tonnes:

And after yesterday's posted withdrawal of over 1MM ounces, Scotia's Comex vault held only 5,148,700 troy ounces of silver.

So, measuring from September of 2013, the drop in Scotia Mocatta's Comex silver vault has been 17,188,272 troy ounces...or about 535 metric tonnes...that's a cumulative 76.9%...in about 26 months.

SUMMARY

Again, we'll leave it up to you, the reader, to decide if something significant is happening behind the scenes OR if what has been displayed above is simply a collection of disparate data points. Maybe ponder these questions over the weekend, though:

  • Is the world's most important bullion bank (JPMorgan) moving gold away from a Comex system that is leveraged to a degree not seen before in its history?
  • Is the world's oldest bullion bank (Scotia Mocatta) relocating gold AND silver away from and out of the same Comex vaulting system?
  • If they are doing so, are these banks signaling that they, too, understand that the days of the current fractional reserve and derivative-based pricing scheme are numbered?
  • As gold and silver exit the Comex system...and as reports continue about physical tightness in London...and as the world continues to run physical silver supply deficits...it at safe to conclude that the system's ultimate collapse is, at a minimum, an eventuality?

I don't know about you, but I think I'll buy some more gold and silver today...and take immediate delivery. The current pricing scheme may not collapse next week or next month (as stated above, we've been writing about this for over five years), but it's not going to last forever, either. And when change does come...and a new system emerges that determines price on the trading of physical and not synthetic metal...I'm quite confident that the prices "discovered" are going to be a little bit higher than $1100/ounce for gold and $14/ounce for silver.

Prepare accordingly.


Please email with any questions about this article or precious metals HERE