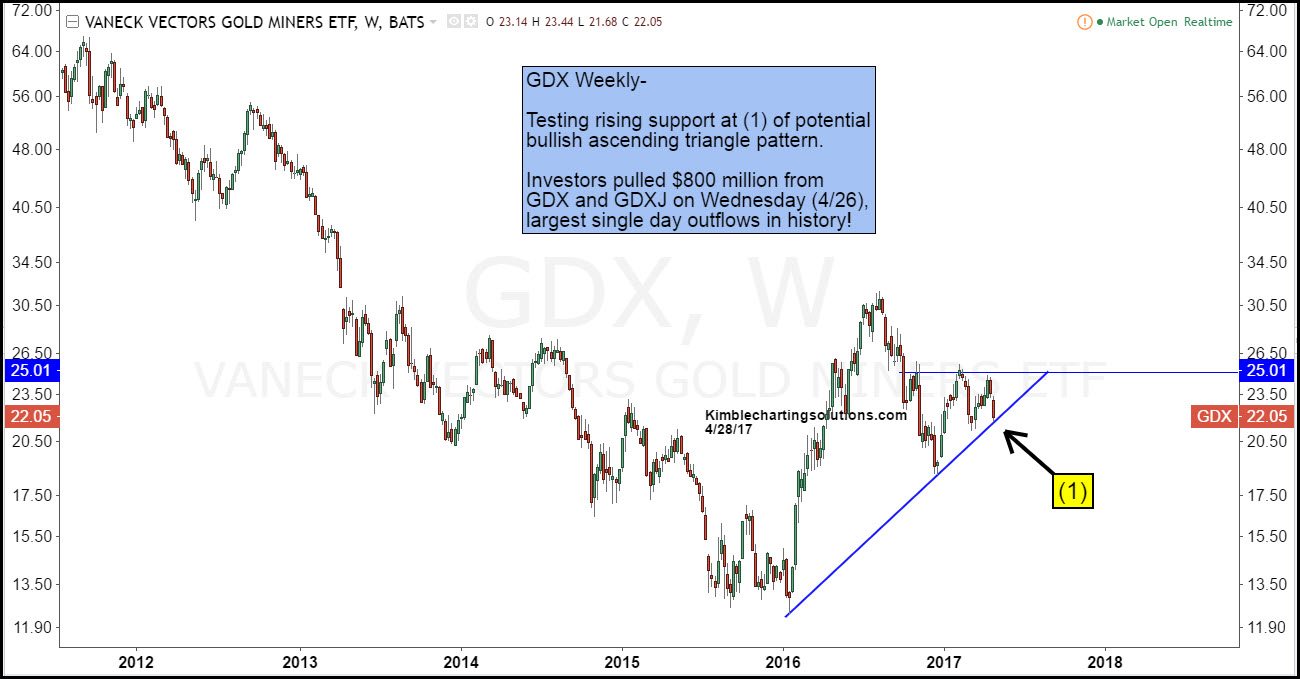
Could historical outflows present an opportunity? Yesterday Sentimentrader.com reported that outflows from Gold Miners ETF’s GDX and GDXJ topped $800 million on 4/26, the largest single day outflows in history.
Below looks at Gold Miners ETF GDX, reflecting where these large outflows took place.
CLICK ON CHART TO ENLARGE
The long-term trend since the highs in 2011 is down (lower highs and lower lows). The 15-month trend appears to be higher, as GDX has created a series of higher lows, since early 2016.
Joe Friday Just The Facts; GDX is testing 1-year rising support at (1), which could be support of a bullish ascending triangle pattern. Two thirds of the time, this pattern suggest higher prices.
It is way too early to tell if investors panicked on Wednesday (huge outflows). From a Power of the Pattern perspective, what takes place at (1), is very important for the miners space, more important than outflows.
If you are a fan of the Gold, Silver and Mining space, we would be honored if you were a Premium or Metals Member.
Send me an email to review a
complimentary copy of our most recent Weekly Metals Research that provides weekly
pattern analysis and actionable ideas on Gold, Silver, Copper and the Miners
Website: KIMBLECHARTINGSOLUTIONS.COM
Blog: KIMBLECHARTINGSOLUTIONS.COM/BLOG
Questions: Email services@kimblechartingsolutions.com or call us toll free 877-721-7217 international 714-941-9381


0 comments:
Post a Comment