Below looks at a long-term chart of the US Dollar, that was shared on 12/30/16. This chart highlighted that King Dollar was facing two long term resistance lines, at the 104 zone. (See Post Here). Joe Friday was pointing out this was a rare test of resistance and could be the price zone, where a major top could take place.
CLICK ON CHART TO ENLARGE
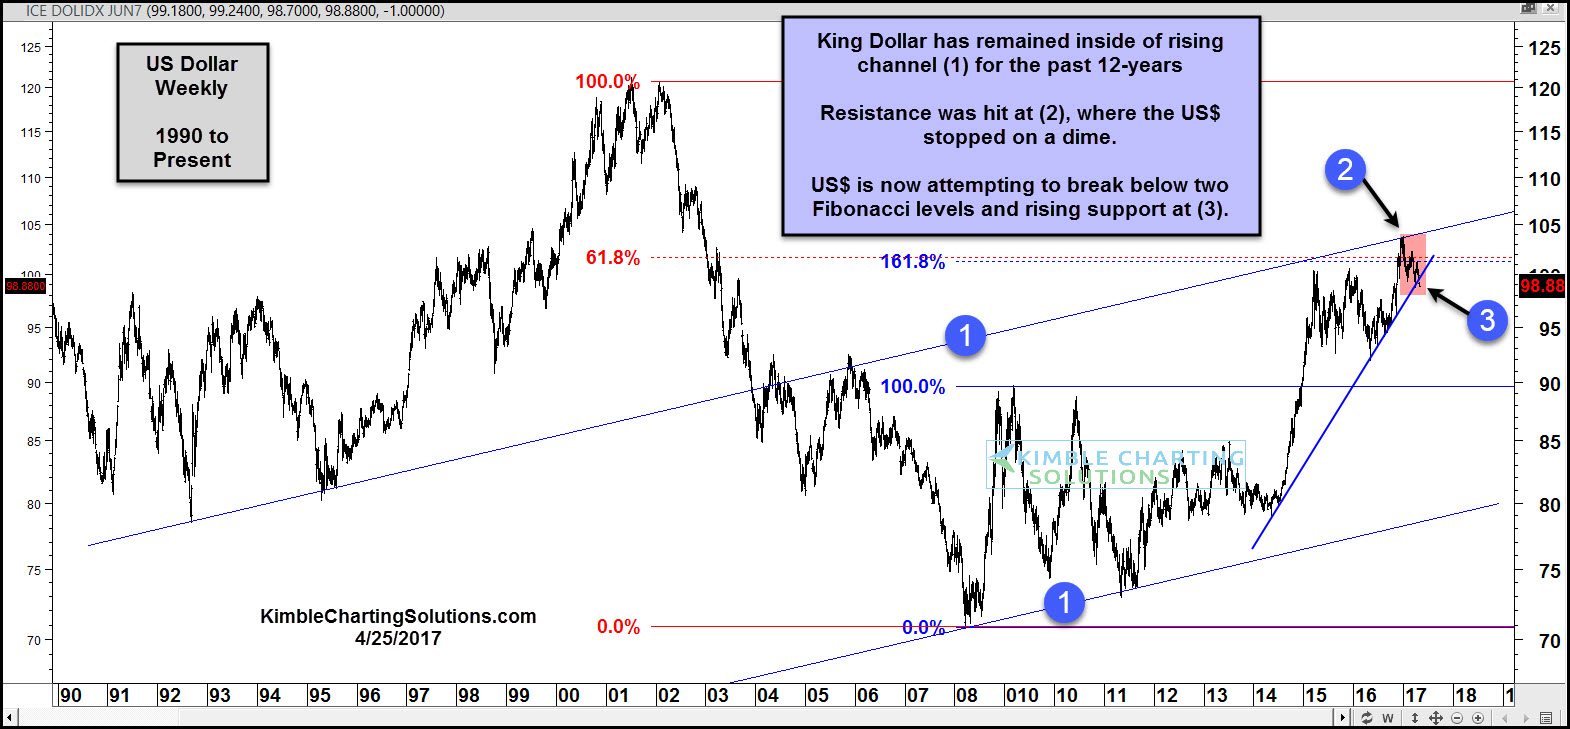
Since Joe Friday pointed out this resistance zone, King$ has declined around 5%, which could be a good reason that Gold, Silver and Mining stocks have done very well so far this year. Below looks at an update on the price action of the US$.
CLICK ON CHART TO ENLARGE
Line (1) has been support and resistance over the past 20-years. US$ hit the underside of this 20-year resistance line at (2), near the 104 zone highlighted in the top chart, where it stopped on a dime. Since hitting resistance line (1), it has declined around 5% and is back below two key Fibonacci levels.
King$ is now testing 3-year rising support at (3). A break of support at (3), could cause more selling pressure to come forward, causing the US$ to further weaken. The Power of the Pattern feels the US$ has to close on a weekly basis below the 93 level, before strong selling pressure would take place. If the 93 level would be taken out to the downside, suspect metals would attract buyers.
Website: KIMBLECHARTINGSOLUTIONS.COM
Blog: KIMBLECHARTINGSOLUTIONS.COM/BLOG
Questions: Email services@kimblechartingsolutions.com or call us toll free 877-721-7217 international 714-941-9381


0 comments:
Post a Comment