The big news this week was the flash crash in silver late on 6 July. We will publish a separate forensic analysis of this, as there is a lot to say and see.
It’s hard to tell—we don’t have the tools to measure such a thing—but it seems like the hype and aggression from the gold bugs and conspiracy theorists is reaching a fever pitch. For example, one high-profile commentator, whose reputation goes way beyond the world of gold, claimed that 1.8 million ounces of gold were sold in a few seconds on June 26. A contract is 100oz, so that means 18,000 contracts. Surprisingly (so often these guys are off by orders of magnitude), this is in line with the data in our own analysis.
On a typical day, it is common for 250,000 (active month) contracts to change hands. This is about 777 tons. That conspiracy theorist compares this quantity to the amount produced by the miners. He does not acknowledge that virtually all of the gold ever mined in human history is still in human hands, and all of that metal is potential supply, at the right price and under the right conditions.
And there is another point. Of course, in a free market there would be no futures market in gold or silver. A futures market is for goods that are produced seasonally, but consumed throughout the year. It is a market for warehousing.
There would be an interest-rate market for gold, i.e. a bond market. A gold futures market is a bizarre creature, a Frankenstein created by the artificial environment of irredeemable currencies and laws that force everyone to use them.
A futures market for gold is a mechanism to turn gold into a chip in the casino, just another way for speculators to bet on the price action, to generation profits in dollars. Like all other derivatives markets, the gold futures market offers leverage so that traders can maximize profits even when price moves are small.
Of course, big leveraged positions mean big risk. That is why traders must set tight stop-loss orders, creating opportunities for other speculators to hunt for stop-loss levels, adding more risk to the casino. And it is also the basis (no pun intended) of our basis analysis. We like to see how much these leveraged bettors are moving the price.
Anyways, back to the idea of peak hype. We think, but again it’s hard to tell, that this corresponds to peak desperation from those who sell gold for a living. Profits per ounce are down, and so are ounces sold. The reality is that it’s a moribund market out there today. If you have a frank and sober discussion with your local dealer—it may help to do this over a beer or two—you will get the same answer. There’s little buying action at retail.
Peak hype, peak desperation, all selling in the streets with little buying… we are not technicians and do not focus on sentiment… but this description sounds like the definition of capitulation.
We would think that by now, the hypsters have about exhausted their credibility, having predicted 100 of the past zero moonshots since 2011. Of course, even if now is the price low, these stopped clocks are not correct for a bullish prediction. Their writing is not really prediction, but sales pitch, perennially permabull.
Also, we would add something important. Even if this is a capitulation low, that does not necessarily a mean a moonshot to $5,000 or even $2,000. We don’t expect that, and won’t expect it without evidence of a much more serious shift in the fundamentals. We would expect a normal trading bounce within the range and perhaps a few bucks over $1,300.
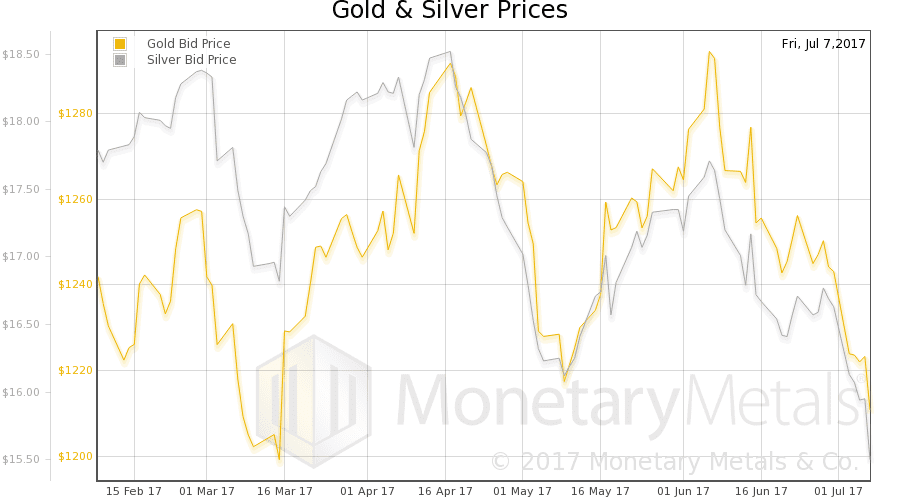
The prices of the metals fell $29 and $1.02.
As always, we are interested in the fundamentals. Did the market change in a durable way? Are gold and silver being devalued? Is it time to capitulate and avoid the rush?
Monetary Metals publishes the only true measure of the fundamentals. But first charts of their prices and the gold-silver ratio.
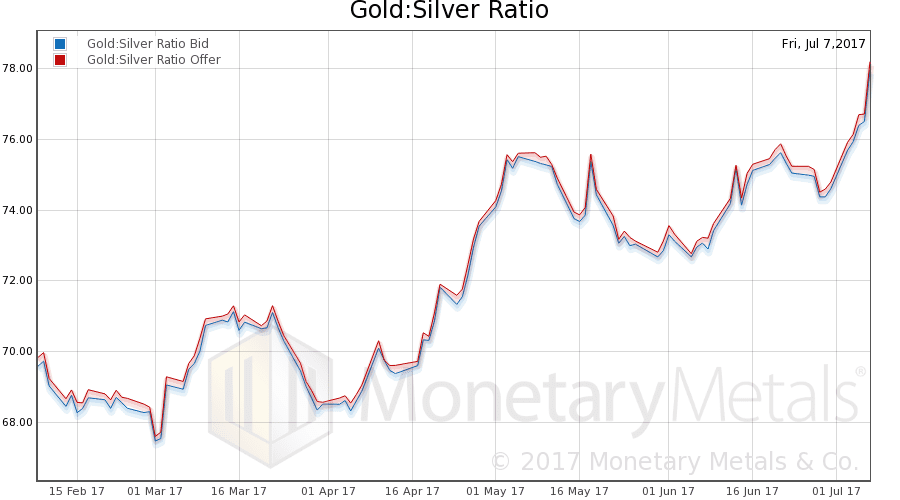
Next, this is a graph of the gold price measured in silver, otherwise known as the gold to silver ratio. The ratio moved up sharply this week, to a new high for the move, over 78.
In this graph, we show both bid and offer prices for the gold-silver ratio. If you were to sell gold on the bid and buy silver at the ask, that is the lower bid price. Conversely, if you sold silver on the bid and bought gold at the offer, that is the higher offer price.
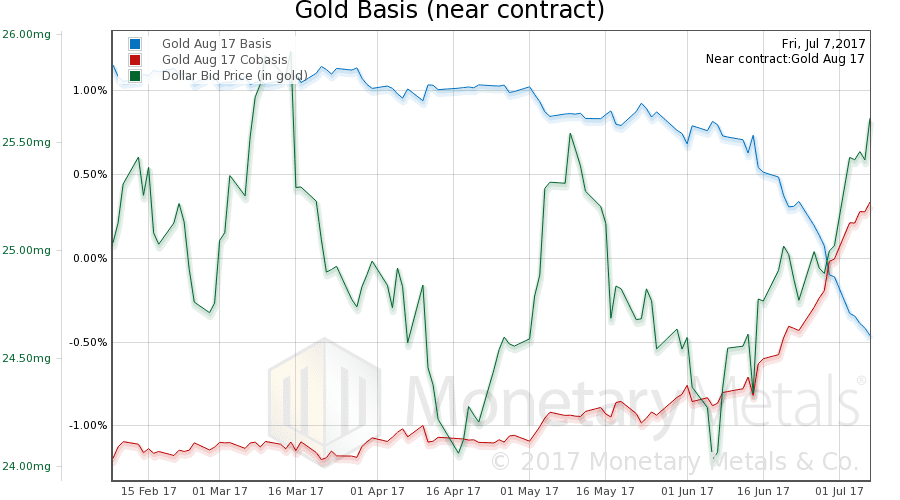
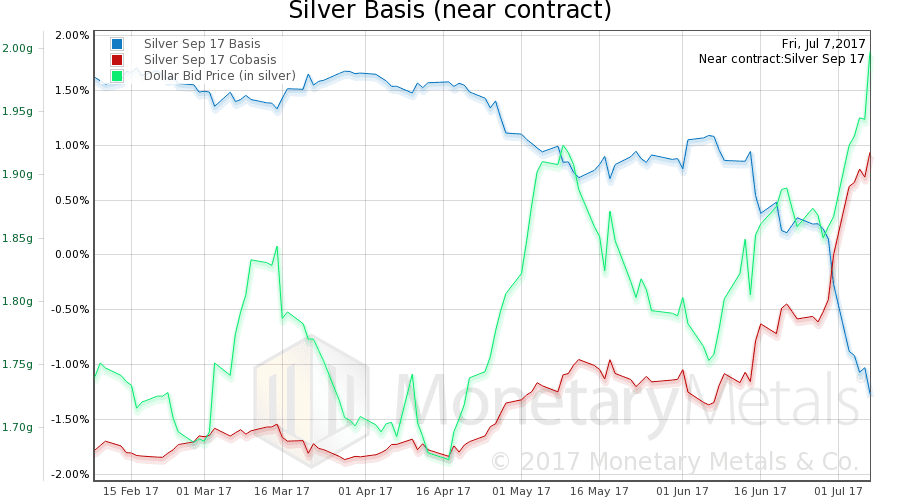
For each metal, we will look at a graph of the basis and cobasis overlaid with the price of the dollar in terms of the respective metal. It will make it easier to provide brief commentary. The dollar will be represented in green, the basis in blue and cobasis in red.
Here is the gold graph.
We had a rising price of the dollar (the mirror image of the falling price of gold). Look at it rise. Those who are all-in on the dollar (which is most people) must be feeling pretty smug right now, unless they measure their dollar against its derivatives such as euro, pound, etc. This is a similar mistake as measuring gold in dollars.
In any case, note the rising backwardation in August gold. Now well over +0.3%. For the October and December contracts, the cobasis is -0.2% and -1%. So it’s still a temporary backwardation, though October is a ways into the future and -0.2% is high.
Our calculated gold fundamental price actually rose about $11 (chart here), to $1345.
Now let’s look at silver.
Last week, the September silver cobasis hit 0, the same as gold. This week it’s over +0.9%. The December cobasis is 0. That is interesting.
Zero is an interesting number for the cobasis, because it’s the margin where decarrying becomes profitable. Decarrying is when you sell metal and buy a futures contract to recover the position. This trade does not require credit, only the metal.
Last week, we said:
It should be interesting to see if the cobasis moves firmly into positive territory this week.
And how! Of course, this was with the dollar rising very sharply in silver terms, from 1.85 grams silver to 2g.
Our calculated silver fundamental price did correct a bit, 26 cents to $17.59. See here for a graph showing the discount (green) or premium (red) for silver. The discount is even greater this week than last week.
Monetary Metals will be exhibiting at FreedomFest in Las Vegas in July. If you are an investor and would like a meeting there, please click here. Keith will be speaking, on the topic of what will the coming gold standard look like.
© 2017 Monetary Metals


0 comments:
Post a Comment