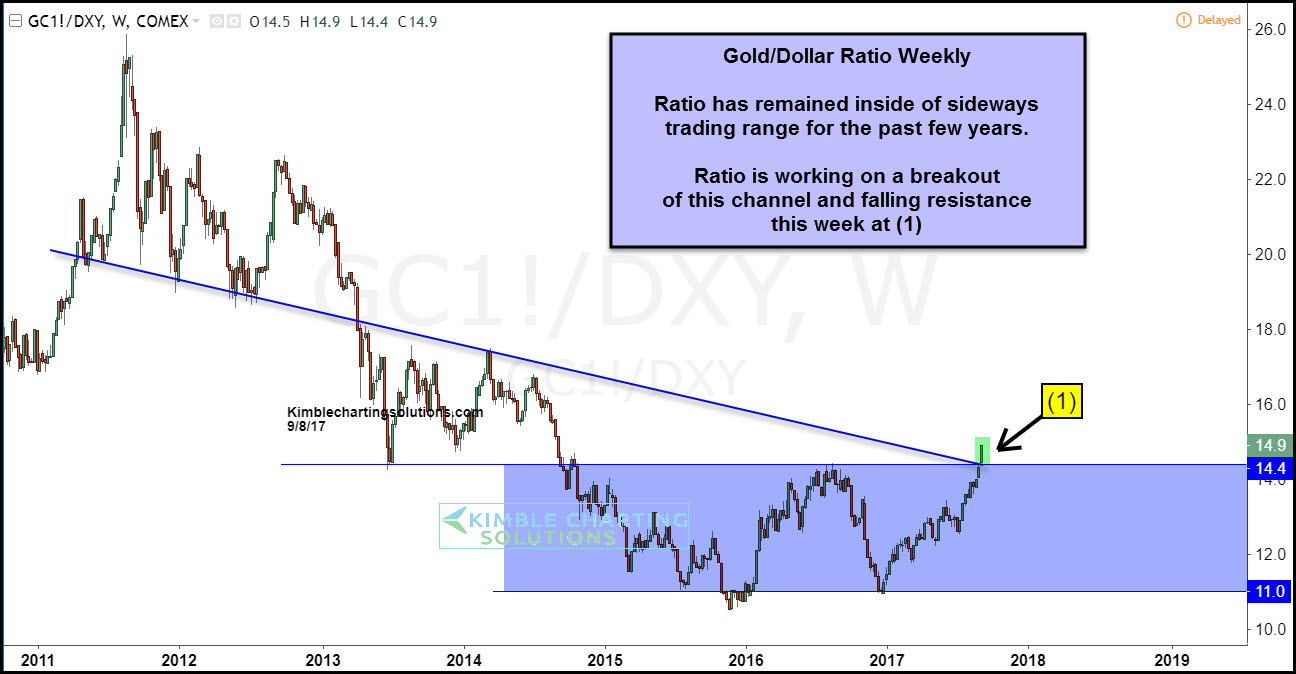
Gold has been weaker than the US$ since 2011 highs, highlighted in Gold/Dollar chart below. The ratio is attempting to do something this week that it hasn’t been able to accomplish the past few years-
CLICK ON CHART TO ENLARGE
The ratio has traded sideways for the past three years, inside the blue shaded zone-
Joe Friday Just The Facts Ma’am– Gold/Dollar ratio is attempting a breakout above dual multi-year resistance this week at (1).
Gold/Dollar strength in the past has been positive for Gold, Silver and Miners. Will it be different this time?
To send a positive message to these assets that these assets are attempting to break a multi-year trend, one needs to see the ratio continue higher.
from Kimble Charting Solutions. We strive to produce concise, timely and actionable chart pattern analysis to save people time, improve your decision-making and results
Send us an email if you would like to see sample reports or a trial period to test drive our Premium or Weekly Research
Email services@kimblechartingsolutions.com
Call us Toll free 877-721-7217 international 714-941-9381
Website: KIMBLECHARTINGSOLUTIONS.COM


0 comments:
Post a Comment